. 2020 Feb 21;69(7):183–188. doi: 10.15585/mmwr.mm6907a2

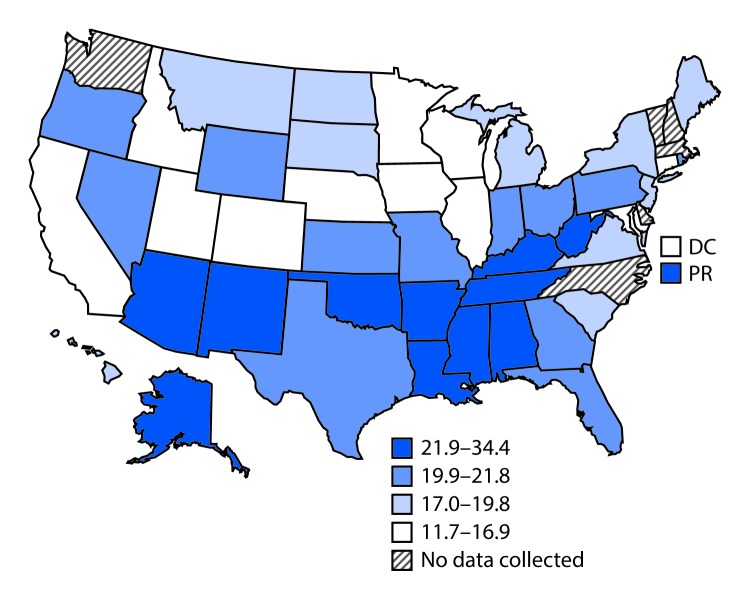
FIGURE 2.

The figure is a map of the United States showing the adjusted percentage of informal, unpaid caregivers reporting fair or poor health during 2015–2017, by state, based on data from the Behavioral Risk Factor Surveillance System.

Adjusted percentage* of informal, unpaid caregivers reporting fair or poor health, by state — Behavioral Risk Factor Surveillance System, United States, 2015–2017

Abbreviations: DC = District of Columbia; PR = Puerto Rico.

*Age-adjusted to the 2000 U.S. Census.