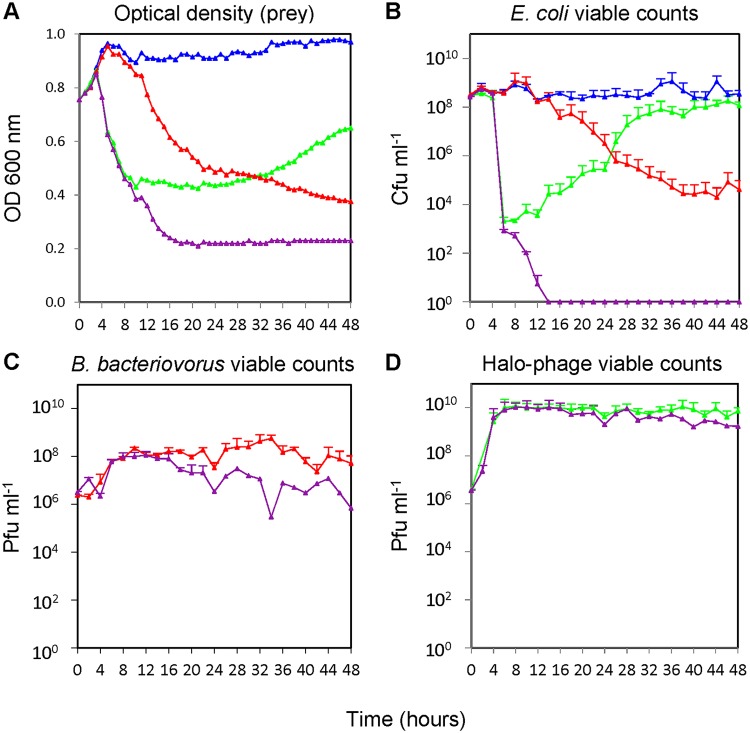
FIG 2.
Kinetics of predation. Measured over 48 h on late-log-phase E. coli S17-1 by bacteriophage halo alone (green), B. bacteriovorus HD100 alone (red), and both bacteriophage halo and B. bacteriovorus HD100 combined (purple) versus E. coli plus buffer control (blue). (A) E. coli measured as the OD600 (B. bacteriovorus organisms are too small to register at OD600). (B) E. coli viable counts. (C) B. bacteriovorus HD100 enumeration by plaque counts. (D) Bacteriophage halo enumeration by plaque counts.

