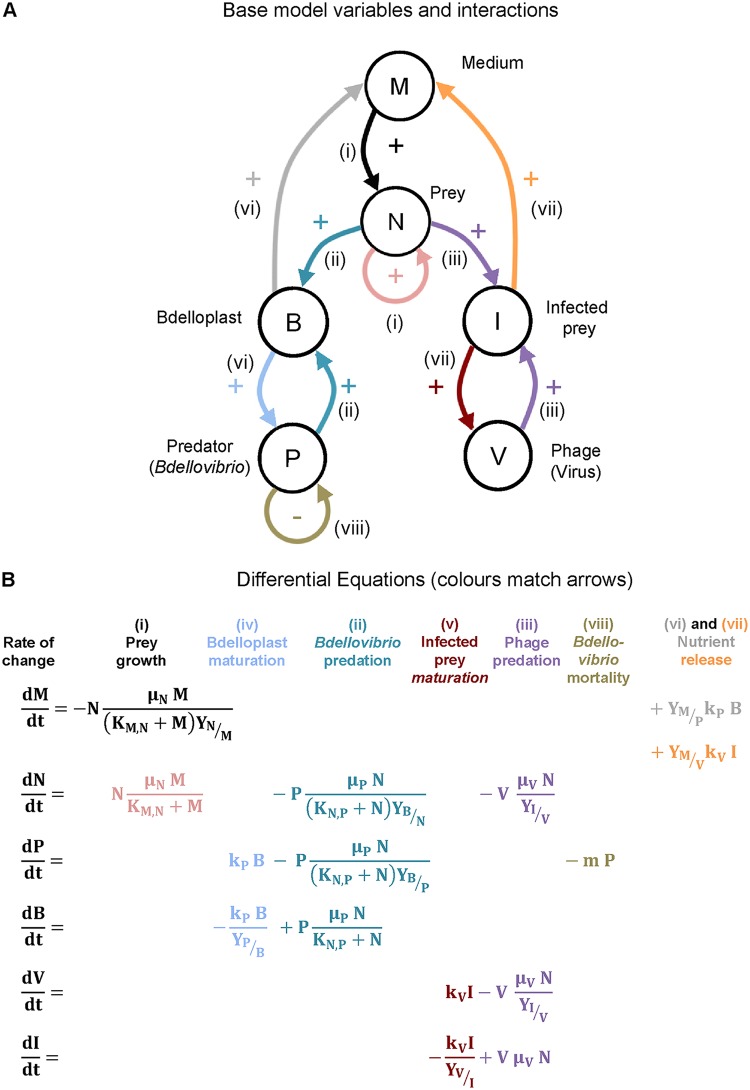
FIG 3.
Base model with one prey type. (A) Diagram of the model variables (populations and chemicals) in circles and their positive or negative interactions. The arrow colors match the colors of the terms in the equations in panel B, and the roman numerals refer to the list of processes in the text. (B) Set of differential equations defining the base model.

