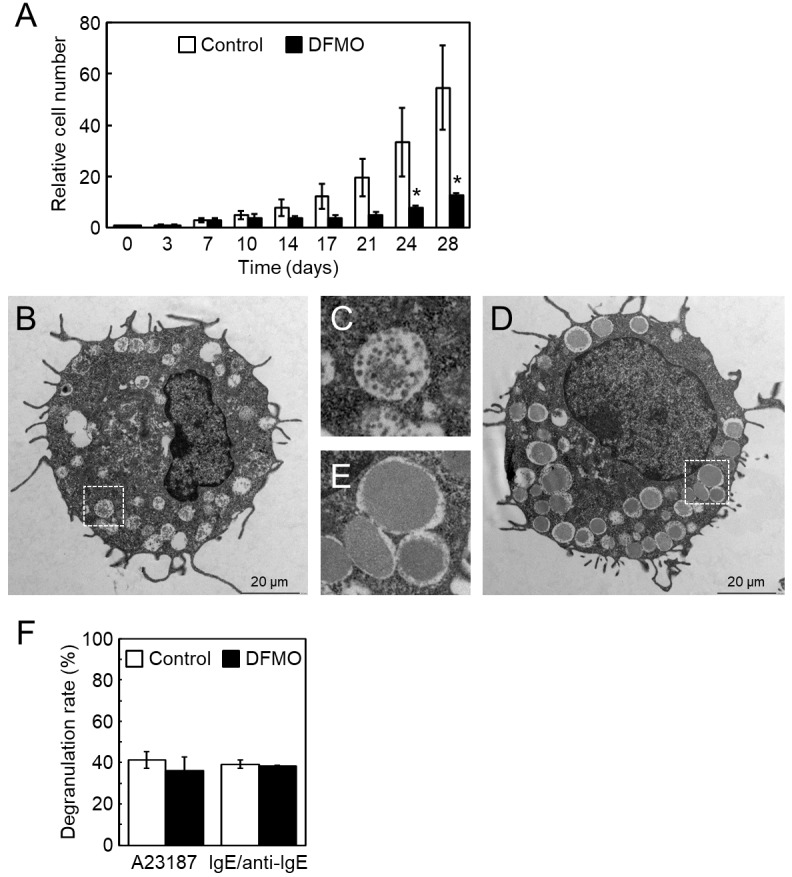
Fig 1. Cell number and morphology of BMMCs in the absence or presence of DFMO.

(A) Starting with 0.1 mM DFMO treatment from day 3, the cells were cultured until day 28. The relative cell number on day 0 is shown as 1. Standard deviation (s.d.) was calculated; n = 3 replicates. *p < 0.05 compared with control. (B) Control and (D) DFMO-treated cells on day 28, observed with transmission electron microscopy. (C) and (E) Boxes with white dots from (B) and (D) in larger magnification, respectively. (F) β-hexosaminidase activity of supernatant and cell pellet after degranulation stimuli (calcium ionophore A23187 or IgE/anti-IgE) was given on day 28. Degranulation rate (%) ± s.d. is shown as [supernatant]/[supernatant + cell pellet], n = 3 replicates.
