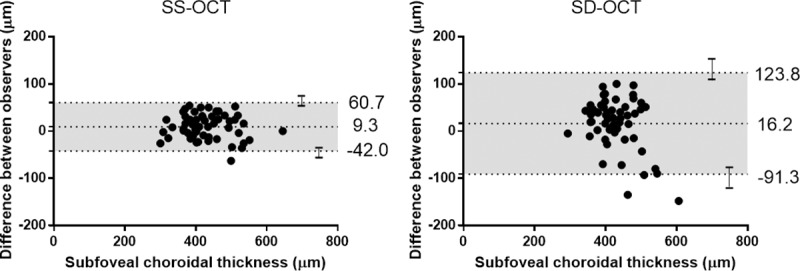
Fig 2. Bland-Altman plots for agreement between two observers using swept source (SS) and spectral domain (SD) optical coherence tomography (OCT).

The dashed lines show mean difference and 95% limits of agreement, and error bars mean 95% confidence intervals for limits of agreement. The spread points of SS-OCT were much smaller than those of SD-OCT.
