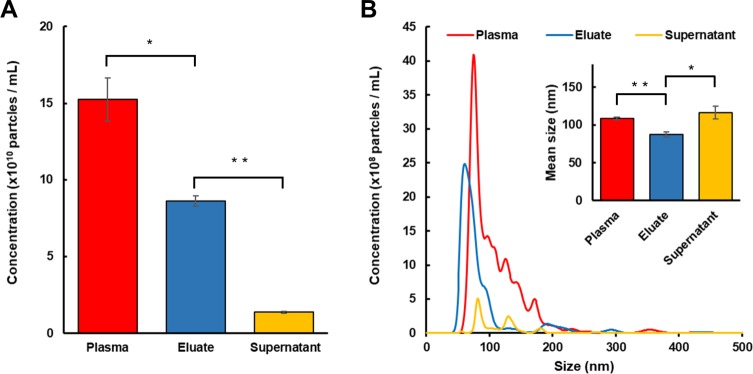
Fig 2. Nanoparticle analysis (NTA) of supernatants and eluates.
NTA was utilized to determine the number (A) and size profile (B) of nanoparticles in the starting platelet-poor plasma (PPP), supernatant after EV enrichment, eluate after formic acid-mediated EV release from magnetic beads. Data are expressed as mean ± SEM (n = 3, ** p < 0.01, * p < 0.05, Student’s t-test).

