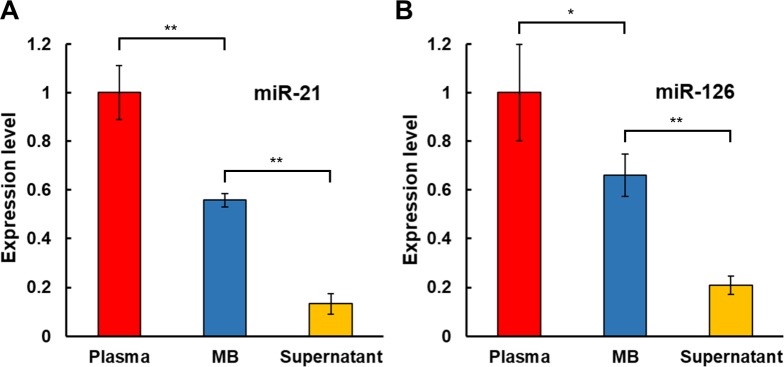
Fig 4. miRNA levels in plasma samples.
Levels of miRNAs hsa-miR-21-5p (n = 4) (A) and hsa-miR-126-3p (n = 5) (B) extracted from platelet-poor plasma, EVs captured on magnetic beads (MB), and supernatant after MB concentration were measured relative to the spike-in exogenous cel-miR-238-3p by RT-qPCR. Data are expressed as mean ± SEM (** p < 0.01, * p < 0.05, Student’s t test).

