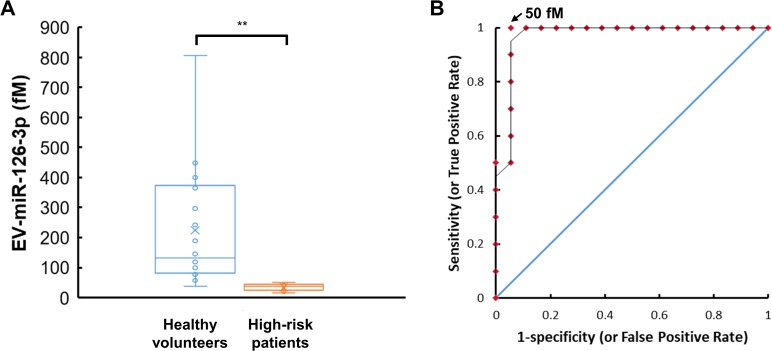
Fig 6. Levels of EV-miR-126-3p in plasma samples from healthy volunteers and high-risk CVD patients.
A box-and-whisker chart shows measured EV-miR-126-3p concentrations in plasma samples from healthy volunteers (n = 18) and CVD patients with elevated levels of cTnI (> 0.5 ng/mL) or NT-proBNP (> 0.125 ng/mL) (n = 10) (A). The sensitivity and specificity were 100% and 94%, respectively, when the threshold EV-miR-126-3p concentration was 50 fM. The area under the receiver operating characteristic (ROC) curve was close to 1 and much greater than that of a randomly selected case shown as a straight line at a 45° angle (B).

