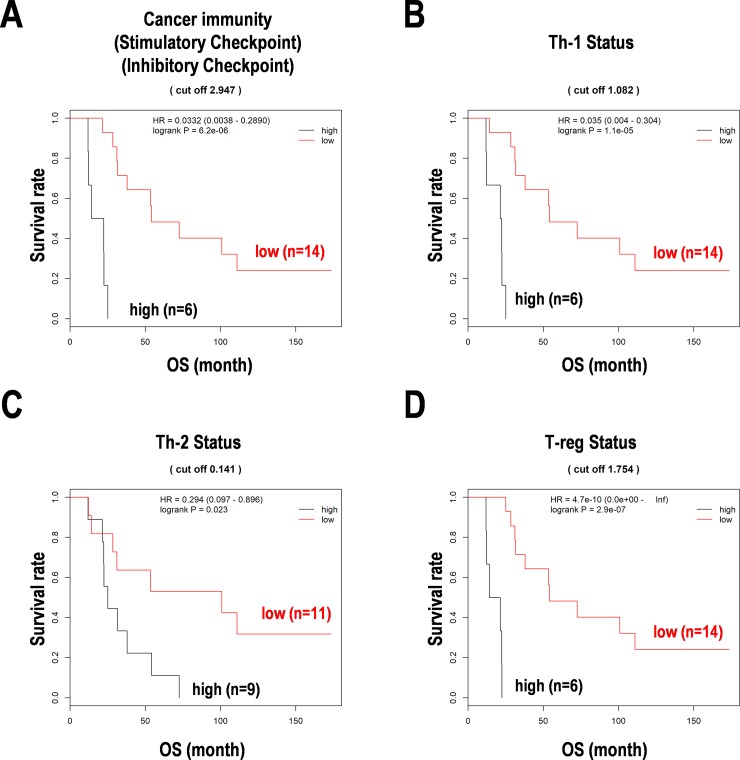
Fig 3. Survival distribution with the formulas based on the Cox regression analysis in PCNSL.
(A) Cancer immunity and immune checkpoints (stimulatory and inhibitory checkpoints). (B) Th1 T-cell status. (C) Th2 T-cell status. (D) Regulatory T-cell (T-reg) status. The Kaplan-Meier curves are drawn by a cut off score calculated by each formula in PCNSL. OS, overall survival. HR, hazard ratio.

