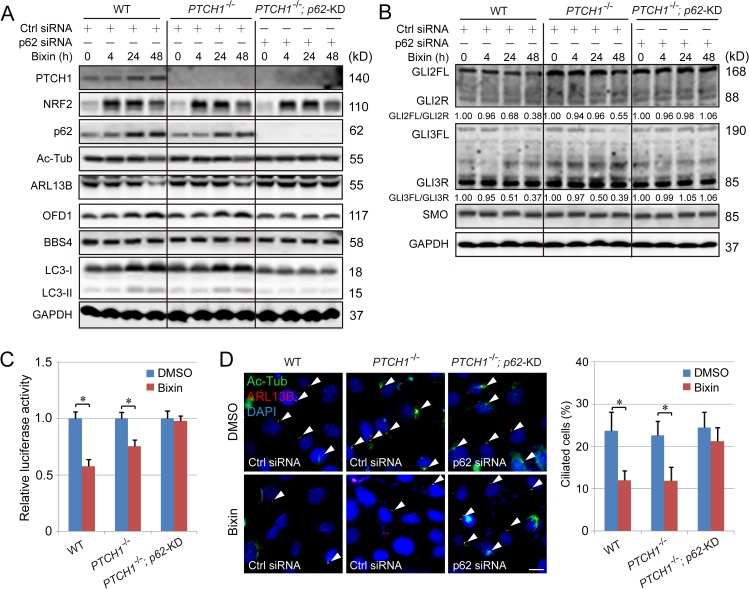
Fig 6. Hh signaling cannot be regulated by NRF2 in PTCH1−/−;p62-knockdown cells.
(A) Immunoblot analysis of PTCH1, NRF2, p62, Ac-Tub, ARL13B, LC3-I and II, OFD1, and BBS4 in WT, PTCH1−/−, and PTCH1−/−;p62-knockdown H1299 cells treated with bixin (40 μM) for 0, 4, 24, or 48 h. Relative quantification of immunoblot results is shown in S10A Fig. (B) Immunoblot analysis of GLI2FL/R and GLI3FL/R, as well as SMO protein levels in WT, PTCH1−/− and PTCH1−/−;p62-knockdown H1299 cells treated with bixin (40 μM) for 0, 4, 24, or 48 h. Relative quantification of immunoblot results is shown in S10B Fig. (C) GLI luciferase assay in WT, PTCH1−/−, and PTCH1−/−;p62-knockdown H1299 cells treated with bixin for 48 h. (D) Percent ciliated cells in WT, PTCH1−/−, and PTCH1−/−;p62-knockdown H1299 cells treated with bixin (40 μM) for 48 hr. (Scale bar = 10 μm.) Results are expressed as mean ± SD. A t test was used to compare the various groups, and p < 0.05 was considered statistically significant. *p < 0.05 compared between the two groups. Ac-Tub, acetylated tubulin; ARL13B, ADP-ribosylation factor-like protein 13B; BBS4, Bardet–Biedl syndrome 4; Hh, hedgehog; KD, knockdown; LC3, microtubule-associated proteins 1A/1B light chain 3B; NRF2, nuclear factor-erythroid 2-like 2; OFD1, oral–facial–digital syndrome 1; PTCH1, Patched 1; siRNA, small interfering RNA; SMO, smoothened; WT, wild type.

