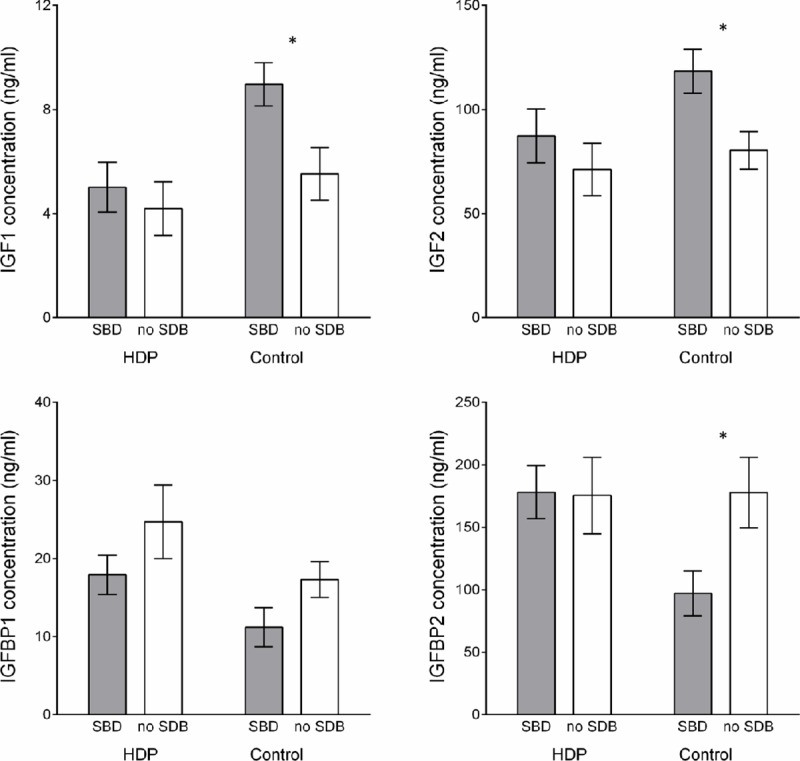
Fig 2. Mean ± SEM insulin-like growth factor 1 and 2 (IGF-1, IGF-2) and insulin-like growth factor binding protein 1 and 2 (IGFBP-1, IGFBP 2) for the SDB vs. No SDB group within the HDP and control group (*p value = .02).

HDP group–SDB n = 17, No SDB n = 13. Control group SDB n = 8, No SDB n = 17, except for IGFBP-1 where HDP group–No SDB n = 12, Control group No SDB n = 16. SDB = sleep-disordered breathing, HDP = hypertensive disorders of pregnancy.
