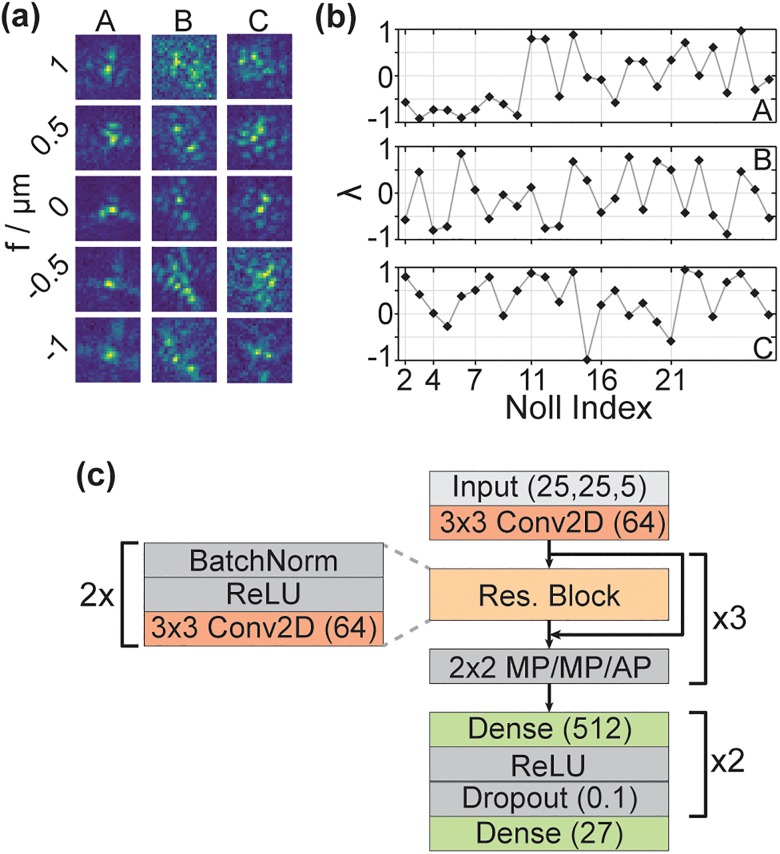
FIG. 2.
(a) Three representative PSFs (A, B, and C) at focal positions from −1 to 1 μm. (b) Zernike coefficients for the three representative PSFs shown in (a). For clarity, only Noll indices that correspond to a change in the order of the Zernike coefficients are marked along the x-axis. (c) Schematic NN architecture. The PSF stack is supplied to the NN as a 25 × 25 pixel image with five channels, corresponding to the five focal positions. After 3 × 3 2D convolution with 64 filters, three residual blocks follow, each consisting of two stacks of batch normalizations, ReLU activation, and 3 × 3 2D convolution with 64 filters. After each residual block, the output of the residual block and its respective input are added. Then, 2 × 2 pooling is performed (MaxPooling, MP, after the first two residual blocks and average pooling, AP, after the third). Finally, two fully connected layers with 512 filters follow, each with ReLU activation and a dropout layer (dropout rate = 0.1). The last layer returns the predicted Zernike coefficients.

