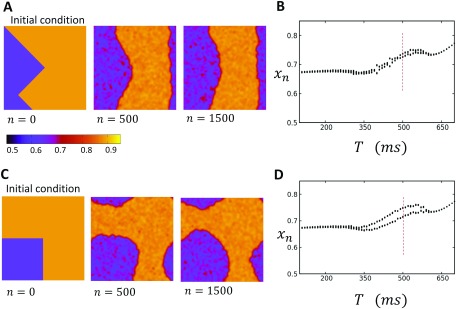
FIG. 10.
Time evolution of different initial conditions in the case of negative voltage Ca coupling. (a) Evolution of a domain wall that joins two opposite sides of the square lattice. Here, the system is paced at for the beats indicated. (b) Bifurcation diagram of system where the initial condition is the same as that in (a). Bifurcation diagram is shown after 1000 beats. Vertical dashed line indicates the pacing rate at which snapshots in (a) are taken. (c) Evolution of a square domain wall at a pacing rate of . The domain walls evolve to form a circular region until reaching a fixed radius. (d) Bifurcation diagram of the system with the initial condition given in (c). Steady state is after 1000 beats. Verical dashed line indicates the pacing rate at which snapshots in (c) are taken.

