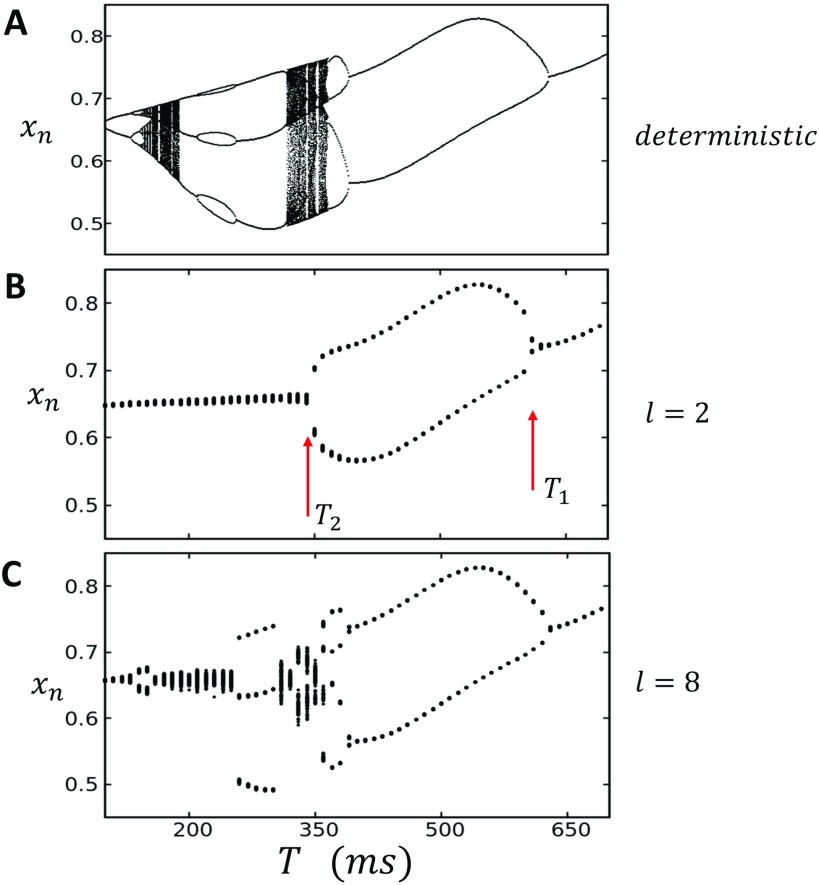
FIG. 2.
(a) Bifurcation diagram of the deterministic map. Nonlinear map given by Eqs. (30)–(32) is paced for 1000 beats, and the steady state SR load is plotted for the last 100 beats. (b) Bifurcation of the stochastic map with diffusion coupling set to . The system is initialized with uniform initial conditions then paced for 1000 beats. The steady state average transitions from an approximate period 1 to a period 2 response beginning at then back to period 1 for . (c) Increasing coupling to uncovers higher order periodicities ranging between P1 and P4.

