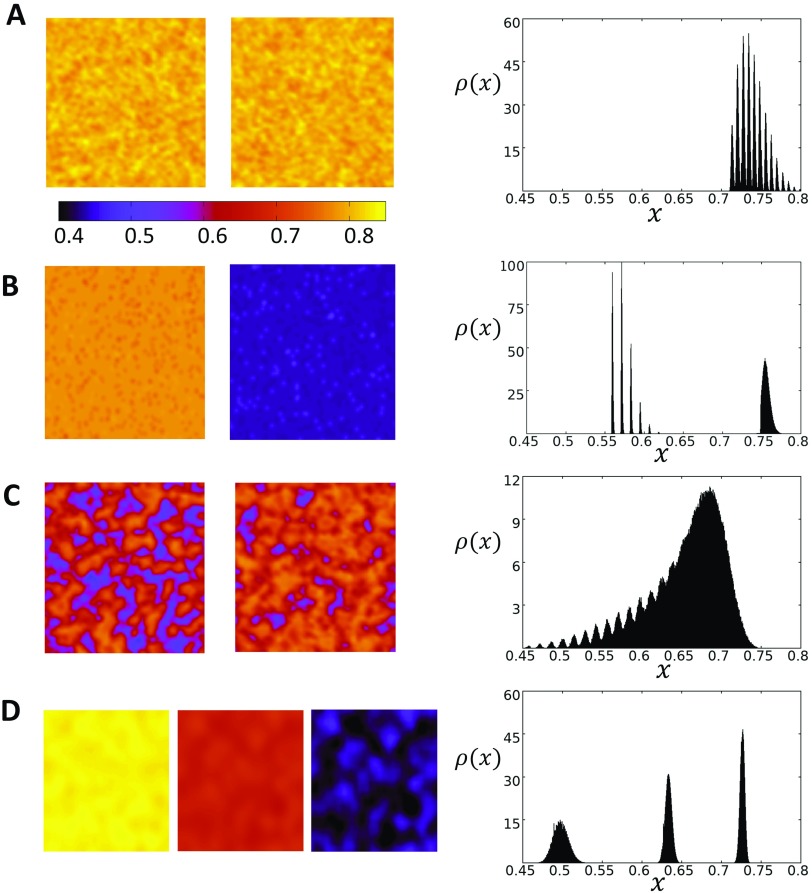
FIG. 4.
Spatiotemporal dynamics of the 2D stochastic map at steady state. The system is initialized with uniform initial conditions with . (a) Coupling strength is set to , and the system is paced at corresponding to the P1 case. Snapshots of the system after 1000 beats show that steady state Ca is spatially uniform with small fluctuations. Color bar indicates the local SR load . The probability density plotted to the right captures the distribution of at steady state and shows that it is sharply peaked in the range [0.7–0.8]. (b) The system is paced at corresponding to the period 2 regime. The SR load is spatially uniform at steady state with the distribution showing two peaks in the range [0.55–0.60] and near 0.75. (c) At , the system exhibits global period 1 behavior as in the case for although the system is spatially disordered. (d) Increasing the spatial coupling to and pacing the system at yield period 3 behavior. The SR load is effectively spatially uniform at each beat and the steady state is distributed around 3 distinct peaks.

