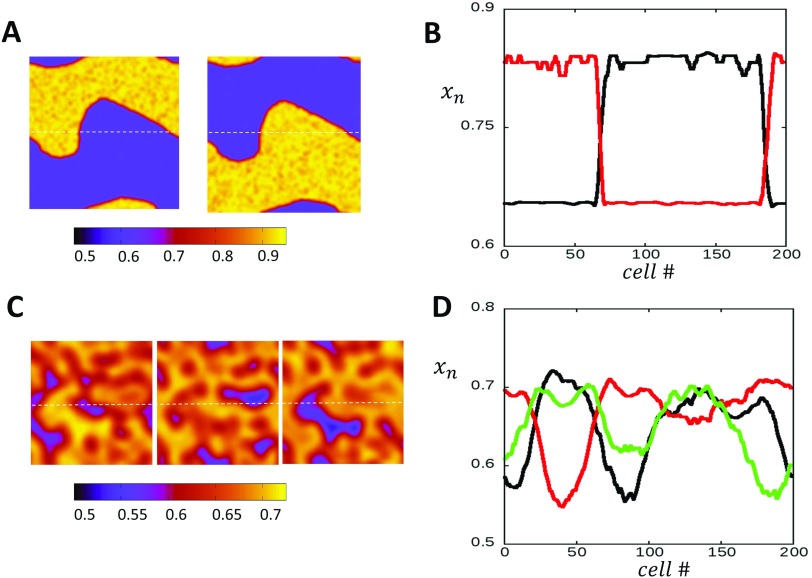
FIG. 5.
(a) Starting with random initial conditions, the system can evolve to a steady state heterogeneous pattern. Snapshots of the system show a domain wall that separates two regions that are out-of-phase. (b) 1D cross section of the system along the dashed line shown in (a). Here, the SR load is plotted at beat 1000 (red) and the next beat (black). (c) The system evolves into disordered patterns with regions that are out of phase, when the coupling strength is increased and paced in the period 3 regime. (d) 1D Cross section showing the desynchronized patterns at steady state for beats 1000, 1001, and 1002. Color bars indicate the SR load.

