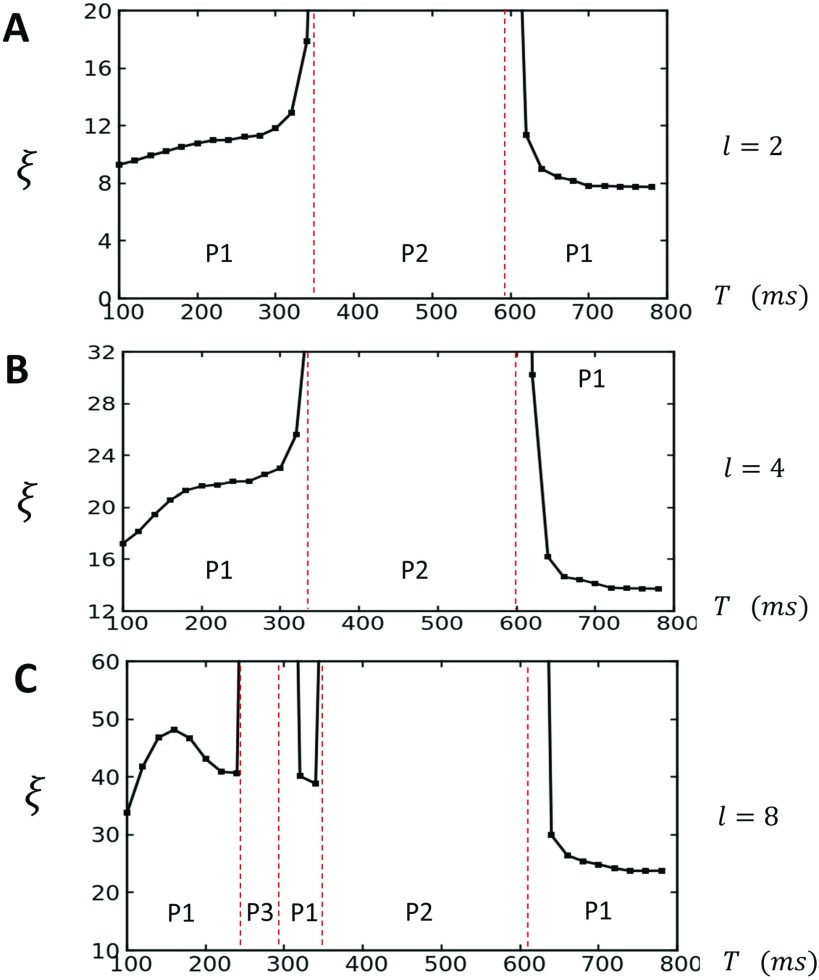
FIG. 6.
The correlation length plotted as a function of T. (a) The case showing that increases to the system size as T approaches the period 2 phase boundary (red dashed lines). (b) Increasing coupling strength to increases the correlation length, with for and for . (c) When increases near the period 2 and 3 transition. Red dashed lines indicate the period at which the transition occurs between the indicated periodicities.

