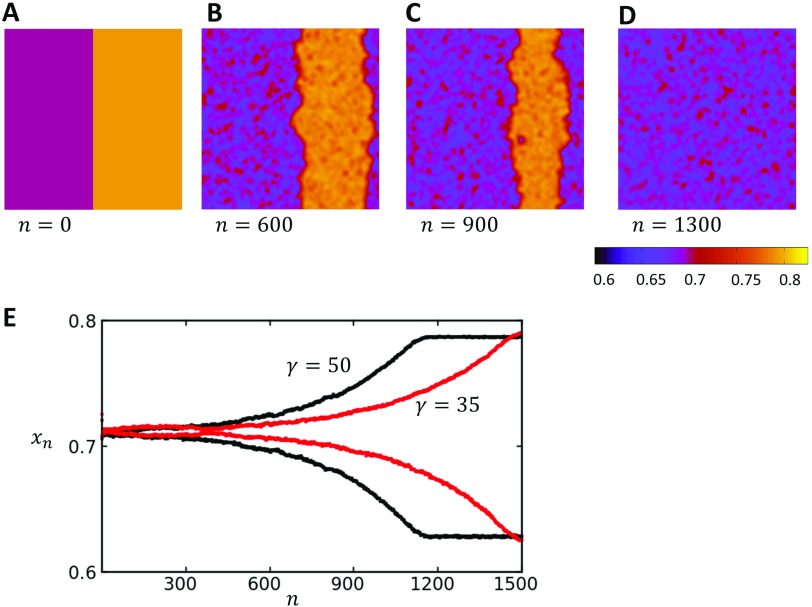
FIG. 8.
(a)–(d) Time evolution of a domain wall that is placed at the center of a system. The pacing rate is , and , so that the system is in the P2 regime shown in Fig. 7(d). The steady state distribution is spatially synchronized and alternates between two SR loads. Color bar indicates the local SR load. (e) The global average SR load as a function of beat number n for two values. Here, we observe that when is reduced, the domain walls remain longer in the system.

