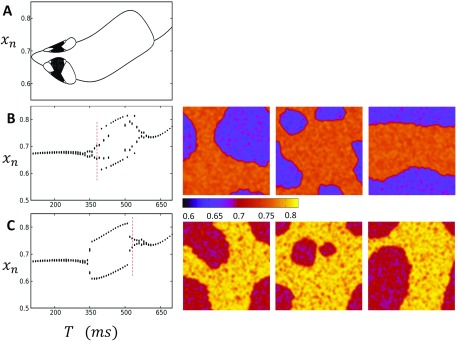
FIG. 9.
(a) Bifurcation diagram of deterministic system when Ca cycling and voltage are negatively coupled . The map shows a typical period doubling bifurcation at higher pacing rates. (b) Bifurcation diagram for the stochastic map model with uniform initial conditions and spatial coupling . To the right are snapshots of three independent simulation runs at , showing distinct steady state patterns after 1000 beats. (c) Bifurcation diagram for the case of random initial conditions and spatial coupling . Snapshots of three independent runs at also evolve to distinct steady state patterns. Vertical dashed lines indicate the pacing rate at which snapshots are taken.

