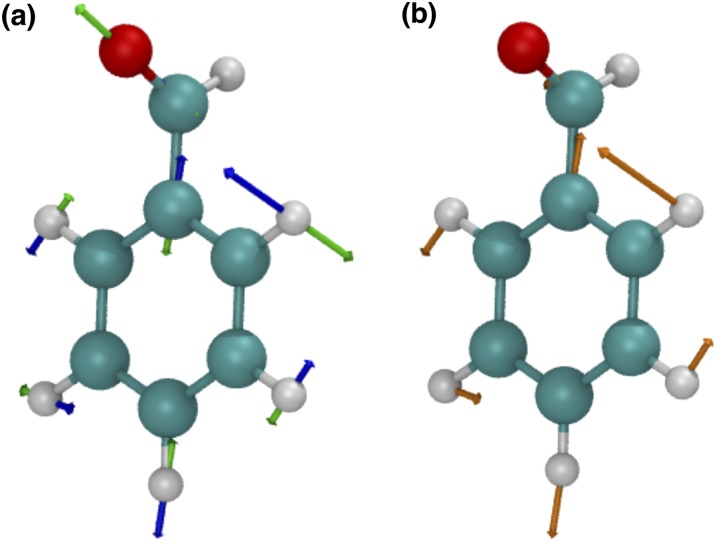
FIG. 6.
The NADC between spin-adiabats 4 and 5 of benzaldehyde (from Fig. 5) before and after rotation by η with a magnetic field of 0.5 T. (a) Using the (fixed but arbitrary) phases that are found by Q-Chem, we plot the real (imaginary) component of the NADC, shown as vectors in blue (green). The total NADC is normalized. (b) After rotation, the real component of the NADC is shown in orange. The imaginary component is too small to be displayed.

