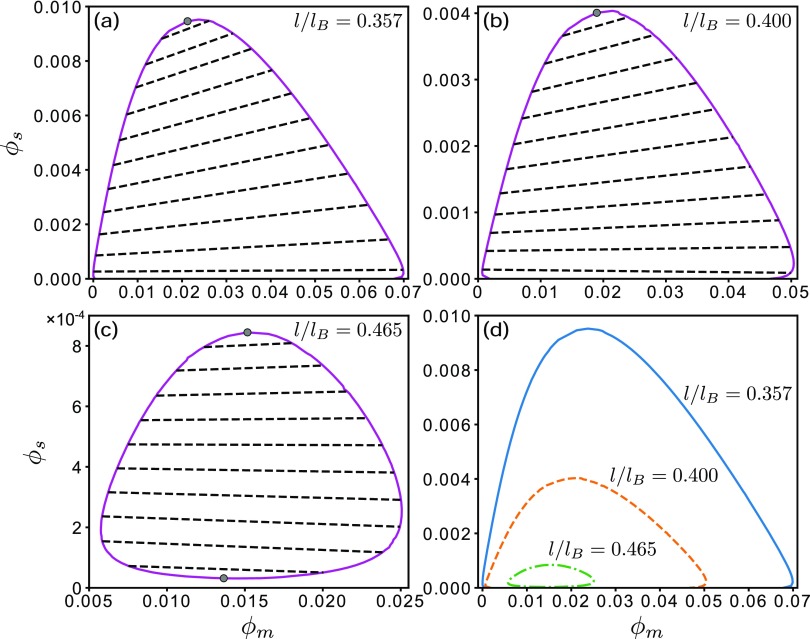
FIG. 6.
Polymer-salt coexistence phase diagrams of at the l/lB values indicated. The salt-free critical value of l/lB is . Top gray circles in (a)–(c) provide the upper critical salt concentrations , whereas the bottom gray circle in (c) provides the lower critical concentration (see discussion in main text). Each dashed line in (a)–(c) is a tie line connecting a pair of coexistent phases. The three phase boundaries in (a)–(c) are compared in (d).

