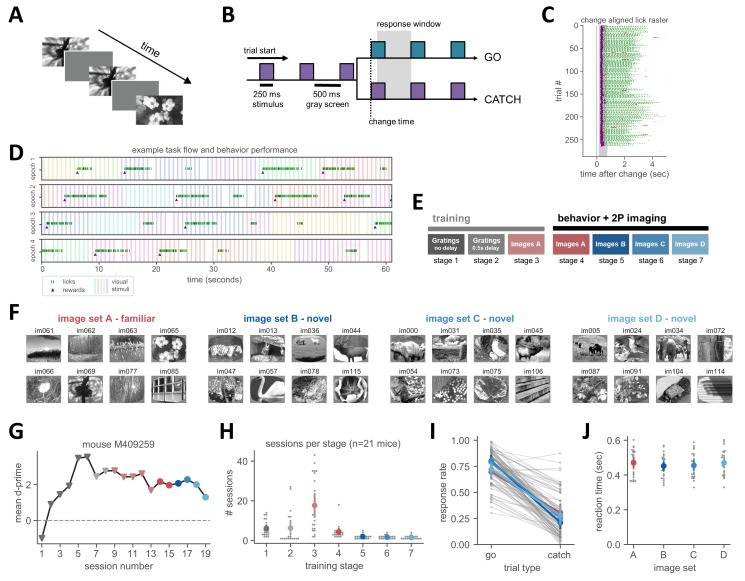
Figure 1. Natural image change detection task with familiar and novel images.
(A) Schematic of stimulus presentation during the task. Images are presented for 250 ms followed by 500 ms of gray screen. (B) Trial structure. Colors represent different images. On go trials, the image identity changes and mice must lick within the 750 ms response window to receive a water reward. On catch trials no image change occurs and the behavioral response is measured to quantify guessing behavior. (C) Example lick raster, aligned to the image change time. Purple dots indicate rewards and green ticks are reward consumption licks. Red ticks indicate incorrect licking responses outside the response window. (D) Example behavior performance over four minutes of one session, separated into one-minute epochs. Colored vertical bars indicate stimulus presentations (different colors are different images). Green tick marks indicate licks, purple triangles indicate rewards. 5% of all non-change image flashes are omitted, visible as a gap in the otherwise regular stimulus sequence. (E) Training stages. Mice are initially trained with gratings of 2 orientations, first with no intervening gray screen (stage 1), then with a 500 ms inter-stimulus delay (stage 2). Next, mice perform change detection with eight natural scene images (stage 3, image set A). During the 2-photon imaging portion of the experiment, mice are tested with image set A as well as three novel image sets (B, C, D) on subsequent days. (F) The four sets of 8 natural images. Image set A is the familiar training set, and image sets B, C and D were the novel sets shown for the first time during 2-photon imaging. (G) Example training time course of one mouse. (H) Number of sessions spent in each stage across mice. Mean ± 95% confidence intervals in color, individual mice in gray. (I) Response rates for go and catch trials are similar across image sets. Individual behavior sessions are shown in gray and average ± 95% confidence intervals across sessions for each image set are shown in color. (J) Reaction times, measured as latency to first lick, are not significantly different across image sets. Mean ± 95% confidence intervals in color, individual sessions in gray.


