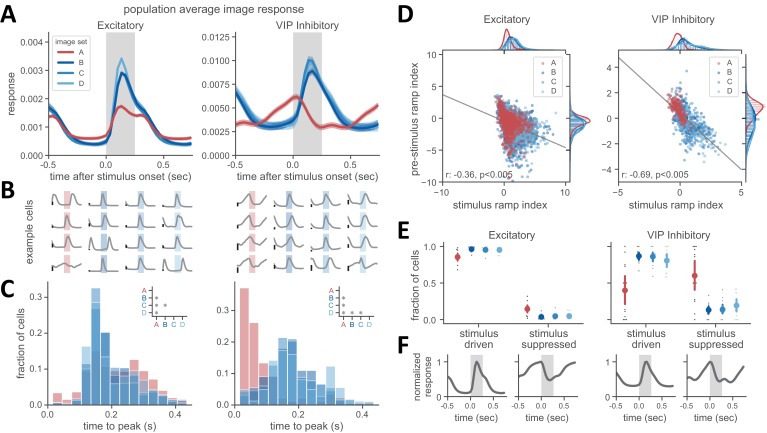
Figure 4. Experience-dependent shift in the dynamics of VIP inhibitory cells.
(A) Population activity averaged over all image presentations for excitatory (left panel) and VIP inhibitory cells (right panel). Traces show mean ± SEM across cells. Note distinct dynamics in VIP population for novel versus familiar images sets. (B) Example single cell traces showing average image-evoked response for excitatory (left panel) and VIP inhibitory cells (right panel). Background shading denotes stimulus presentation, with color indicating the image set shown during the session for that cell. Each trace represents a unique cell recorded in a single session. Scale bar on left of each trace indicates a response magnitude of 0.005. (C) Histogram of time to peak response after stimulus onset for excitatory (left panel) and VIP inhibitory cells (right panel). Inset shows comparisons across image sets where p<0.008 (Welch’s t-test with Bonferroni correction was used for all statistical comparisons, see Materials and methods for additional details). (D) Stimulus ramping and pre-stimulus ramping are negatively correlated. Each point is one neuron. The stimulus ramp index was computed over a 125 ms window after stimulus onset. The pre-stimulus ramp index was computed over a 400 ms window prior to stimulus onset. Data points across all image sets for each panel were fit with linear least-squares regression. Correlation and significance values for the fit are shown in lower left of each panel. (E) Novel image sets have an increased fraction of cells with stimulus-driven activity, whereas a larger fraction of cells was stimulus-suppressed for familiar images. Cells with a positive stimulus ramp index are considered stimulus-driven and those with a negative ramp index are stimulus-suppressed. p<0.008 for all comparisons with image set A. (F) Population average image evoked response for cells that met the criteria for stimulus driven or stimulus-suppressed, as described in panel E.


