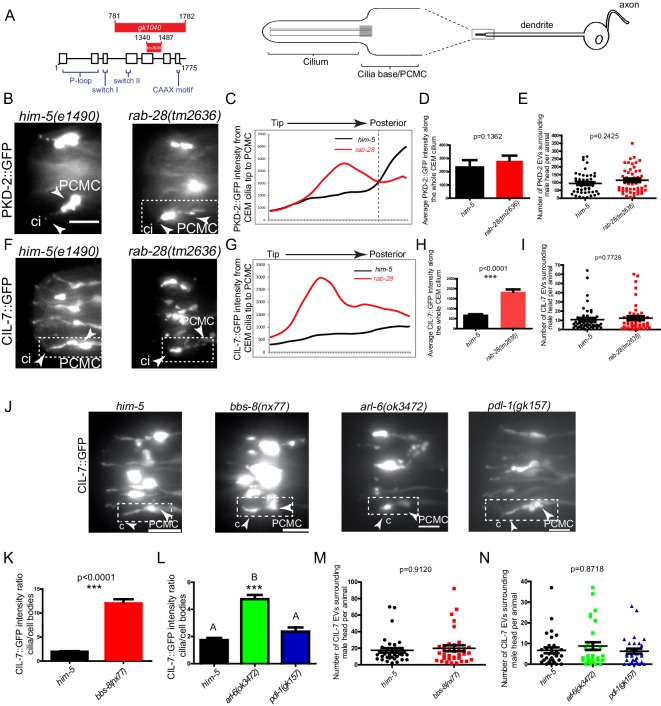
Figure 4. RAB-28 and BBSome components regulate the localization of ciliary EV cargoes in EV-releasing CEM cilia.
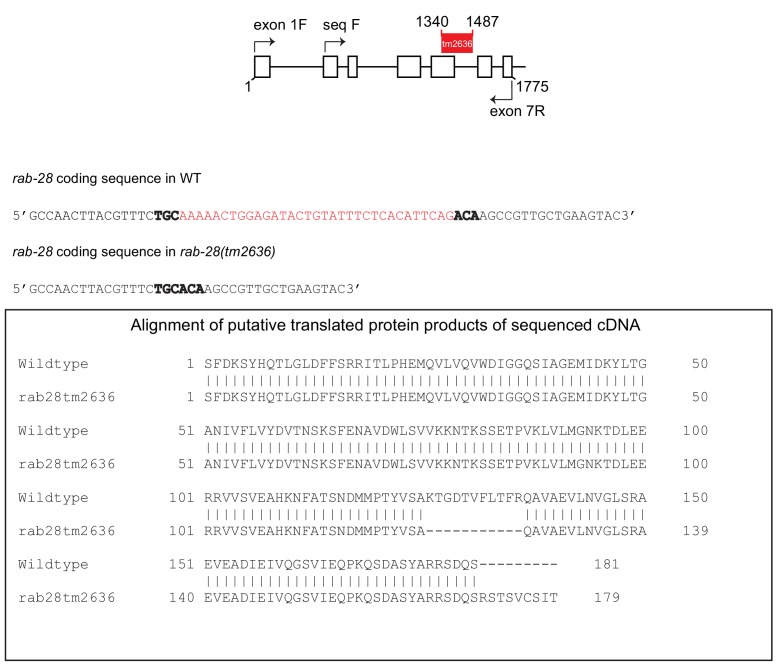
(A) Left- schematic showing the location of the deleted regions in the gk1040 and tm2636 mutant alleles of rab-28. Right- cartoon modified from Bae et al. (2006) depicting the morphology of the CEM neurons of C. elegans. PCMC; periciliary membrane compartment. (B, F) Fluorescence micrographs of CEM cilia of control and rab-28(tm2636) males expressing PKD-2::GFP or CIL-7::GFP. Dotted white boxes mark one CEM cilium (ci), including the PCMC (periciliary membrane compartment) at the base. Scale bars; 5 μm. (C, G) Plot profiles of PKD-2::GFP and CIL-7::GFP intensity across different points along the cilium in control and rab-28(tm2636) adult males. Traces run from the ciliary tip and posterior towards the PCMC. Each data point represents the average GFP intensity at an individual point on several cilia in many animals of each genotype. rab-28(tm2636) males (n = 57 cilia from 36 males) accumulate more PKD-2 anterior to the site where PKD-2 accumulation is greatest in control males (n = 46 cilia from 32 males). rab-28(tm2636) males (n = 32 cilia from 18 males) accumulate more CIL-7 along the length of the cilium compared to controls (n = 48 cilia from 34 males). (D, H) Bar charts depicting mean PKD-2::GFP and CIL-7::GFP intensity along the cilium length of control and rab-28(tm2636) adult males. Error bars depict SEM. p values calculated by a Mann-Whitney test. For control, n = 40 (D) and 47 (H); for the rab-28 mutant, n = 50 (D) and n = 32 (H) cilia. Data is from three separate experiments. (E, I) Scatter plots depicting the number of PKD-2::GFP- and CIL-7::GFP-positive EVs surrounding the male head per animal between control and rab-28(tm2636). Horizontal line depicts the mean. Error bars depict SEM. p values calculated by a Mann-Whitney test. For control, n = 47 (E) and n = 46 (I) males; for the rab-28 mutant, n = 48 (E) and n = 47 (I) males. (J) Fluorescence images of CIL-7::GFP in the male heads of the indicated genotypes. Scale bars; 5 μm. (K, L) Bar charts depicting the ratio of CIL-7::GFP intensity between the ciliary and cell body regions in the indicated genotypes. Error bars show SEM. p values in K determined by Mann-Whitney test. n = 21 males for both genotypes in K and n = 27 males for all genotypes in L. Letters above each dataset in L indicate results of statistical analysis; data sets that do not share a common letter are significantly different at p<0.0005 (Kruskal–Wallis test with Dunn’s post-hoc correction). (M, N) Scatter plots depicting the number of CIL-7::GFP-labeled EVs released from the indicated genotypes. Error bars depict SEM. p values determined by a Mann-Whitney test (M) or Kruskal-Wallis test with Dunn’s multiple comparisons (N). n = 34 (M) and n = 31 (N) males.


