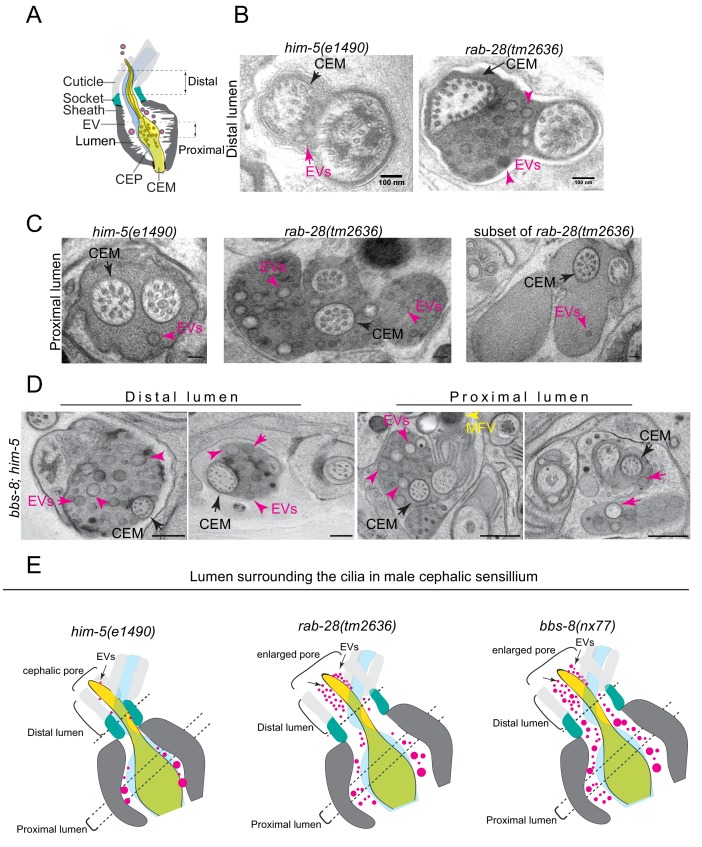
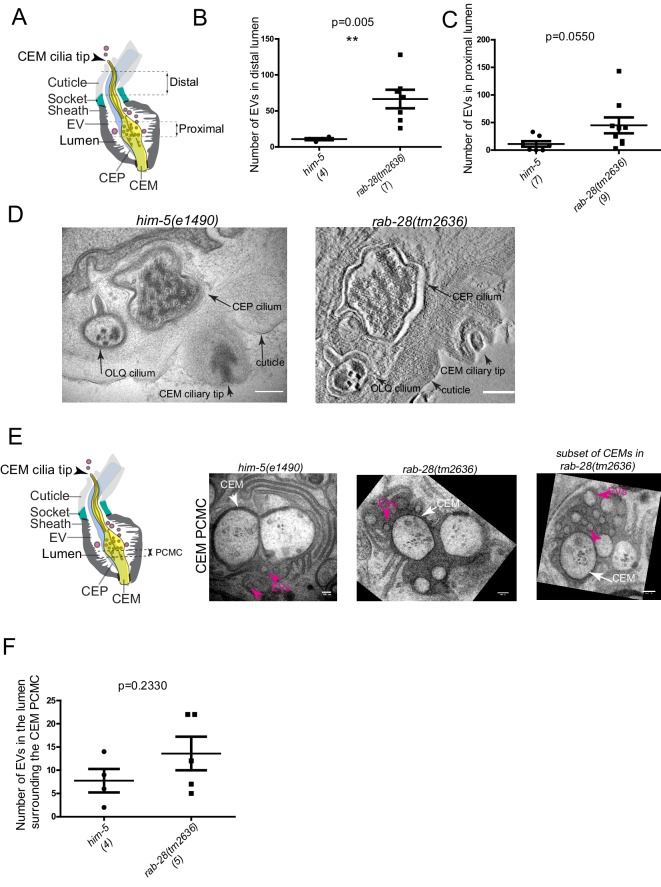
Figure 5. RAB-28 and BBS-8 are negative regulators of EV shedding.
(A) Cartoon of the ultrastructure of the cephalic sensory organ reproduced from Wang et al. (2014a). EVs (magenta spheres) are ‘shed’ from the PCMC/ciliary base into the lumen and ‘released’ into the environment outside of the worm. (B) Transmission electron micrographs of the cephalic lumen surrounding the distal region of CEM cilia. Black arrows point to the CEM and magenta arrows to EVs. rab-28(tm2636) accumulate significantly more EVs in the lumen distal to the singlet region of CEM compared to control males. Scale bars; 100 nm (C) Transmission electron micrographs of the cephalic organ at the level of the CEM cilium transition zone. Scale bars; 100 nm. A subset of the rab-28(tm2636) animals accumulate EVs in the cephalic lumen surrounding the TZ. (D) TEM cross sections of the proximal and distal regions for the cephalic lumen of bbs-8 mutant males. Black arrows point to the CEM cilium. Ectopic EVs (magenta arrows) are observed at distal and proximal regions of the lumen. Matrix filled vesicles (MFVs) in cephalic sheath are marked by yellow arrowheads. Scale bar; 200 nm. (E) Cartoon depictions of the lumen surrounding the cilia in the male cephalic sensillum in control, rab-28(tm2636), and bbs-8 mutants. Color scheme is the same as the cartoon in (A). Brackets enclose the cephalic sensory organ pore region. rab-28 mutant males accumulate an excess of EVs (labeled by magenta spheres and pointed to by arrows) in the lumen surrounding the more distal portion of the CEM axoneme whereas bbs-8 mutant males accumulate excessive EVs at all levels of the cephalic lumen. rab-28 and bbs-8 mutants also have an enlarged cephalic pore/opening of the sensory organ.


