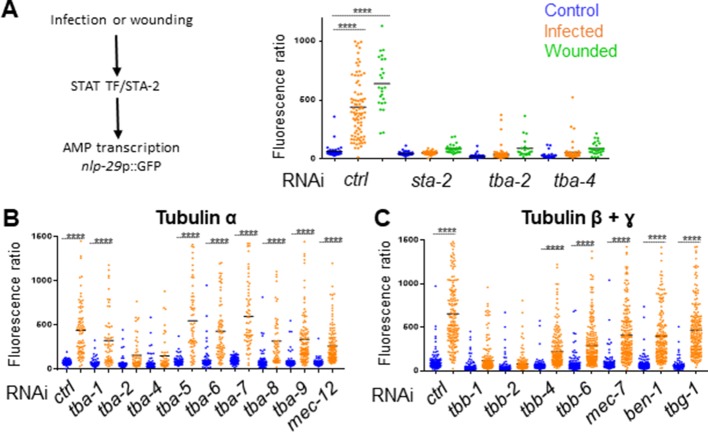
Figure 5. Specific tubulin isoforms are required for the activation of the immune response upon wounding and fungal infection.
Quantification of green fluorescence in a strain carrying the nlp-29p::GFP transcriptional reporter after RNAi against different tubulin α, β and γ genes in non-infected worms or after infection with D. coniospora or after wounding (blue, orange and green symbols, respectively). The ratio between GFP intensity and size (time of flight; TOF) is represented in arbitrary units. (A) Worms were fed on RNAi bacteria from the L4 stage and after 24 hr infected or wounded; sta-2(RNAi) is known to block the immune response (Dierking et al., 2011). (B, C) Worms sensitive to RNAi primarily in the adult epidermis were fed on RNAi clones from the L1 stage and infected with D. coniospora at the young adult stage. Mean are represented in black, numbers of worms in 5A: 47, 87, 25, 48, 46, 26, 66, 107, 21, 33, 52, 28; in 5B: 106, 82, 67, 59, 63, 57, 112, 51, 95, 65, 88, 76, 79, 65, 128, 58, 98, 121, 69, 138; in 5C: 228, 180, 199, 210, 201, 162, 145, 232, 220, 224, 147, 207, 196, 188, 133, 209. Only ****p<0.0001 is presented; ANOVA Bonferoni’s test. Graphs are representative of the results obtained from at least three independent replicates.
Figure 5—figure supplement 1. Worms are efficiently infected after knock-down of tubulin gene expression by RNAi.
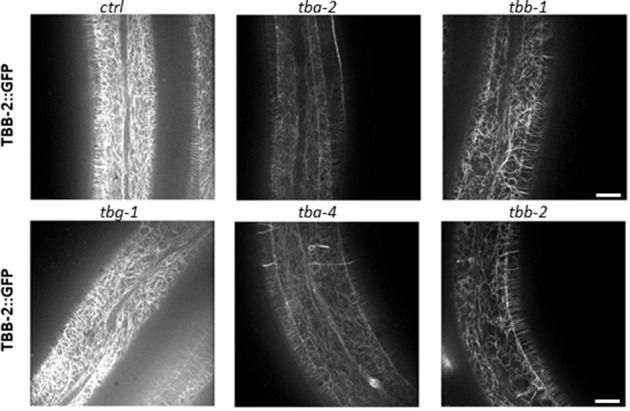
Figure 5—figure supplement 2. RNAi against tba-2, tba-4, tbb-1 and tbb-2, but not tbg-1 alters the pattern of MTs in the adult epidermis.


