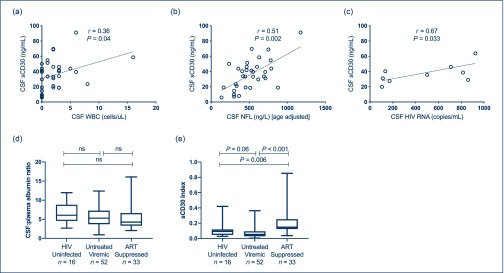
Figure 3.
(a) CSF sCD30 correlates with CSF WBC in the ART-suppressed subgroup. (b) CSF sCD30 correlates with age-adjusted CSF NFL in the ART-suppressed subgroup. (c) CSF sCD30 correlates with CSF HIV-1 RNA in individuals with CSF HIV-1 ‘escape’. (d) CSF:plasma albumin ratio in HIV-uninfected, untreated viraemic and ART-suppressed individuals. (e) sCD30 index in HIV-uninfected, untreated viraemic and ART-suppressed individuals. Note: r and P values represent nonparametric calculations; lines represent best-fit linear regression. ART: antiretroviral therapy; CSF: cerebrospinal fluid; NFL: neurofilament light chain protein.

