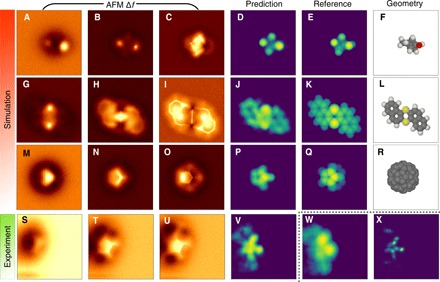
Fig. 2. Examples of CNN prediction from simulated and experimental data.

(A to F) A molecule from the validation set with formula C7H10O2. (G to L) A dibenzo[a,h]thianthrene molecule (49). (M to U) A fullerene C60 [experimental data in (S) to (U)]. (V to X) Comparison of image descriptors, vdW-Spheres, height map, and atomic disk representation (see the SM for explanation) predicted from experimental images of C60. Columns 1 to 3 show simulated AFM signal (Δf) at different heights. Column 4 shows the vdW-Spheres representation predicted by the trained CNN (naturally, the reference is not available for experiment). Column 5 shows the reference vdW-Spheres representation calculated directly from geometry. Column 6 depicts a 3D render of the molecule.
