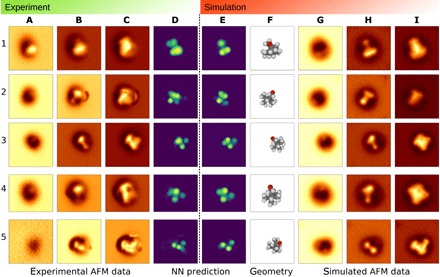
Fig. 4. Identification of the 1S-camphor adsorption configurations on Cu(111) with ASD-AFM.

1 to 5 refer to distinct molecular configurations with experiments in columns (A) to (D) and simulations in columns (E) to (I). Selected experimental AFM images (out of 10 slices used for input): at (A), far; (B), middle; (C), close tip-sample distances; and NN prediction (D) for the vdW-Spheres representation. The vdW-Spheres representation shown in (E) corresponds to the full molecular configuration (F) resulting from the best match to the experiment. The corresponding simulated AFM images are given in (G) to (I) (far, middle, and close).
