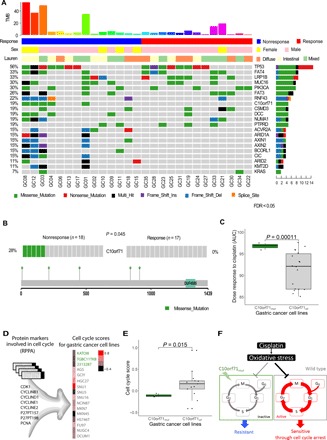
Fig. 3. Significantly mutated genes in pretreatment GC samples.

(A) Selected significantly mutated genes (SMGs) identified by MuSiC2 [false discovery rate (FDR) < 0.05] in pretreatment tumor samples. The bars on the top and on the right show the mutational rate observed for each patient and the composition of mutations in selected genes, respectively. Genes are ordered by their mutational frequencies, and different types of mutations are marked in different colors. (B) C10orf71 shows a significant mutation bias in the nonresponse samples (P < 0.045). The mutational sites are shown in the gene cartoon. (C) C10orf71 mutations are associated on the resistance to cisplatin in gastric cell lines; t test, P = 1.1 × 10⁻⁴. AUC, area under the curve. (D) Functional proteomic profiling of cell cycle based on eight protein markers in reverse-phase protein arrays. (E) C10orf71 mutations are associated on a lower cell cycle score in gastric cell lines; t test, P = 0.015. (F) A proposed mechanistic model in which C10orf71 mutations confer resistance to neoadjuvant chemotherapy through causing a less active cell cycle state.
