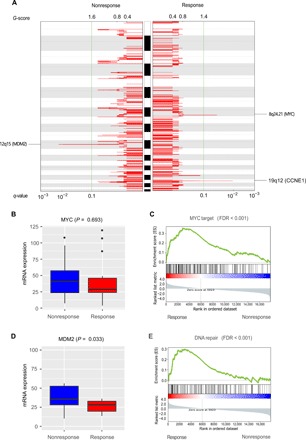
Fig. 4. Significant SCNAs and their downstream signaling effects in pretreatment GC samples.

(A) Amplification signals for SCNAs plotted for response versus nonresponse groups. Two cancer genes, MYC and CCNE1, reside in the unique peaks at 8q24.21 and 19q21, respectively, in the response group, while MDM2, a negative regulator of TP53, resides in the unique peak at 12q15 in the nonresponse group. MYC (B) and MDM2 (D) mRNA expression levels in the nonresponse and response groups. P values were based on one-tailed Wilcoxon rank sum test. The middle line in the box is the median, the bottom and top of the box are the first and third quartiles, and the whiskers extend to 1.5× interquartile range of the lower and the upper quartiles, respectively. Enrichment of MYC target genes (C) and DNA repair pathway (E) in the up-regulated genes in the response group relative to the nonresponse group. FDR was based on gene set enrichment analysis.
