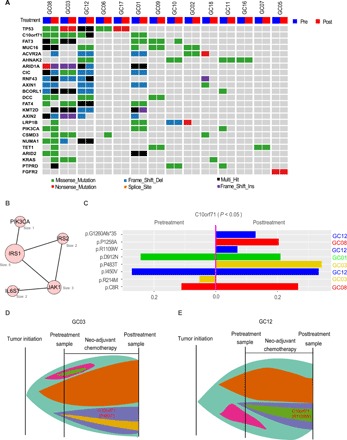
Fig. 5. Mutational evolution following neoadjuvant chemotherapy.

(A) Mutational profiles in cancer genes before and after neoadjuvant chemotherapy. (B) The top subnetwork enriched in mutational alterations following the treatment. The size of the circle indicates the number of samples with a mutation in the network. (C) The mutational allele frequencies in the coding region of C10orf71 before and after treatment in four patients. P value was based on paired t test. Mutations in different patients are shown in different colors. (D and E) A schematic representation of the putative evolution of the acquired C10orf71 mutations in the two patients.
