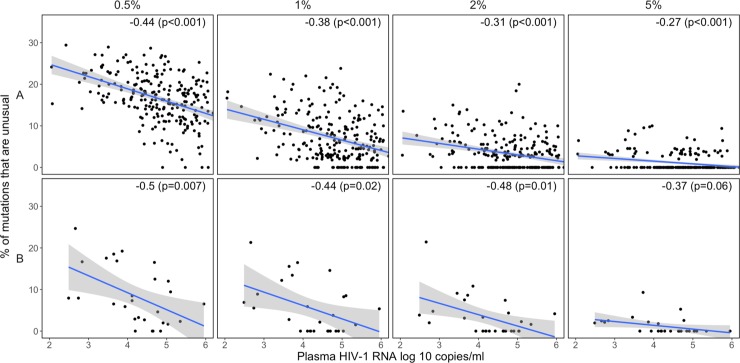
Fig 4. Scatter plots demonstrating the relationship between virus load (plasma HIV-1 RNA log copies/ml) and the proportion of positions with unusual mutations at four NGS mutation detection thresholds in two of the three studies for which virus load data were available [21, 23, 24]: study A [23], study B [24].
The upper-right hand corner of each plot contains the Pearson correlation coefficient (r) and its associated p value.

