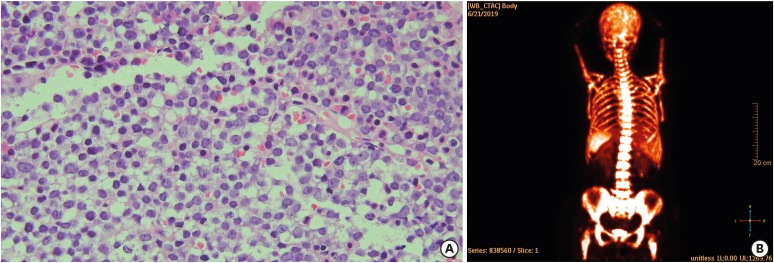
Figure 3. Histology of bone marrow biopsy and 18F-FDG PET/CT scan of acute lymphoblastic leukemia (A) Bone marrow examination showing abnormal lymphocytes with hematoxylin-eosin staining, at a magnification of 400×, (B) 18F-FDG PET/CT image demonstrating diffuse hypermetabolism along the whole axial and appendicular bones and spleen with no residual hypermetabolism in the mass in the left breast.
FDG = fluorodeoxyglucose; PET/CT = positron emission tomography/computed tomography.

