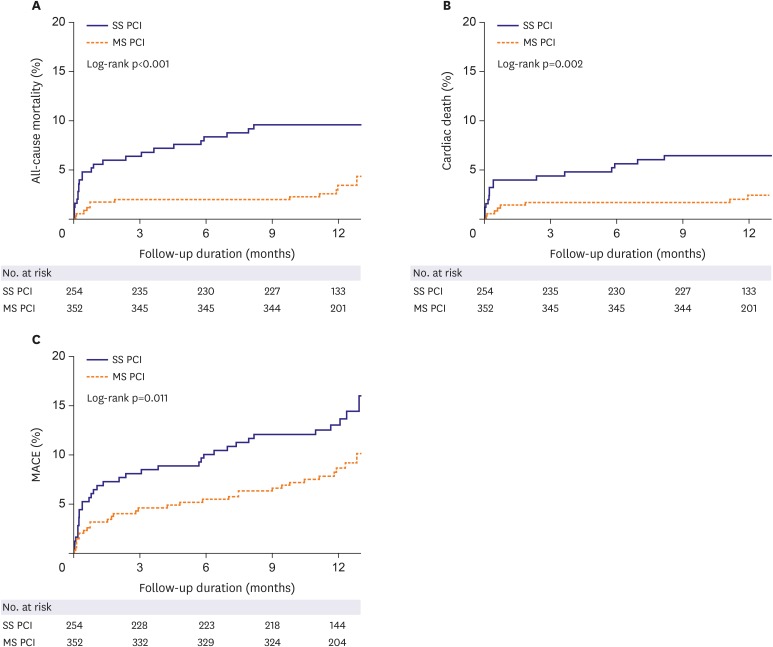
Figure 2. Event rates of all-cause mortality, cardiac death and MACE for the entire patients at 1-year of follow-up. The Kaplan-Meier curves for cumulative event rates of all-cause mortality (A), cardiac death (B) and MACE (C) were shown according to the type of revascularization. Multi-vessel SS PCI group showed a higher rate of all-cause mortality (27% vs. 12%), cardiac death (19% vs. 8%), and MACE (16.9% vs. 10.2%) at 1-year of follow-up.
MACE = major adverse cardiovascular event; MS PCI = multi-staged percutaneous coronary intervention; SS PCI = single-staged percutaneous coronary intervention.

