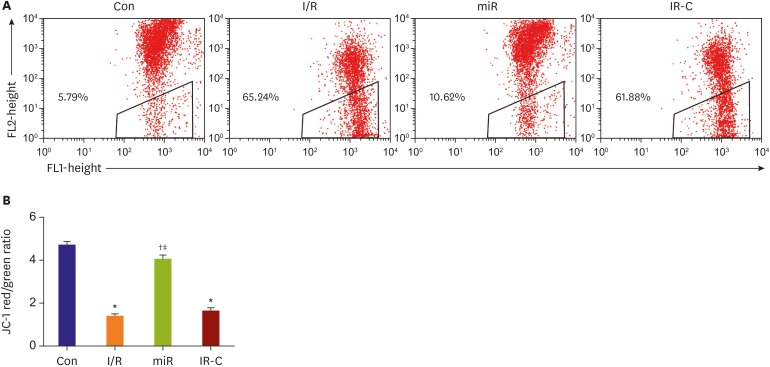
Figure 4. Mitochondrial membrane potential in myocardial cells. (A) Red-green fluorescence in myocardial cells detected by flow cytometry. (B) Red/green ratio of full-color fluorescence.
Con = control (sham operate); I/R = ischemia-reperfusion; IR-C = ischemia-reperfusion negative control; miR = miR-484 treatment.
*p<0.05 compared with Con on group; †p<0.05 compared with I/R group; ‡p<0.05 compared with IR-C group.

