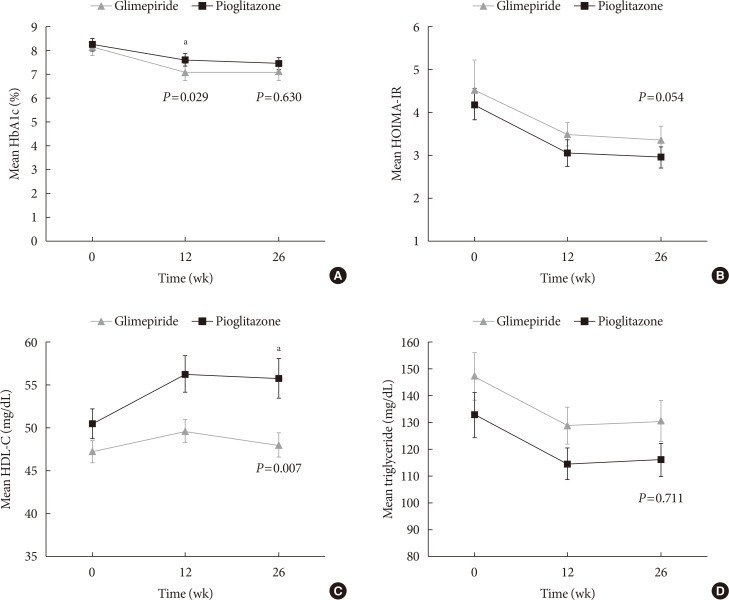
Fig. 2. Changes in the measured variables at 12 weeks and 26 weeks. Mean±standard error values at baseline, 12 weeks, and 26 weeks were calculated for (A) glycosylated hemoglobin (HbA1c), (B) homeostatic model assessment of insulin resistance (HOMA-IR), (C) high density lipoprotein cholesterol (HDL-C), and (D) triglycerides during 26-week treatments using glimepiride (closed triangles) or pioglitazone (closed quadrangles) for patients with type 2 diabetes mellitus who were concurrently receiving combination therapy using alogliptin and metformin. aP<0.05.

