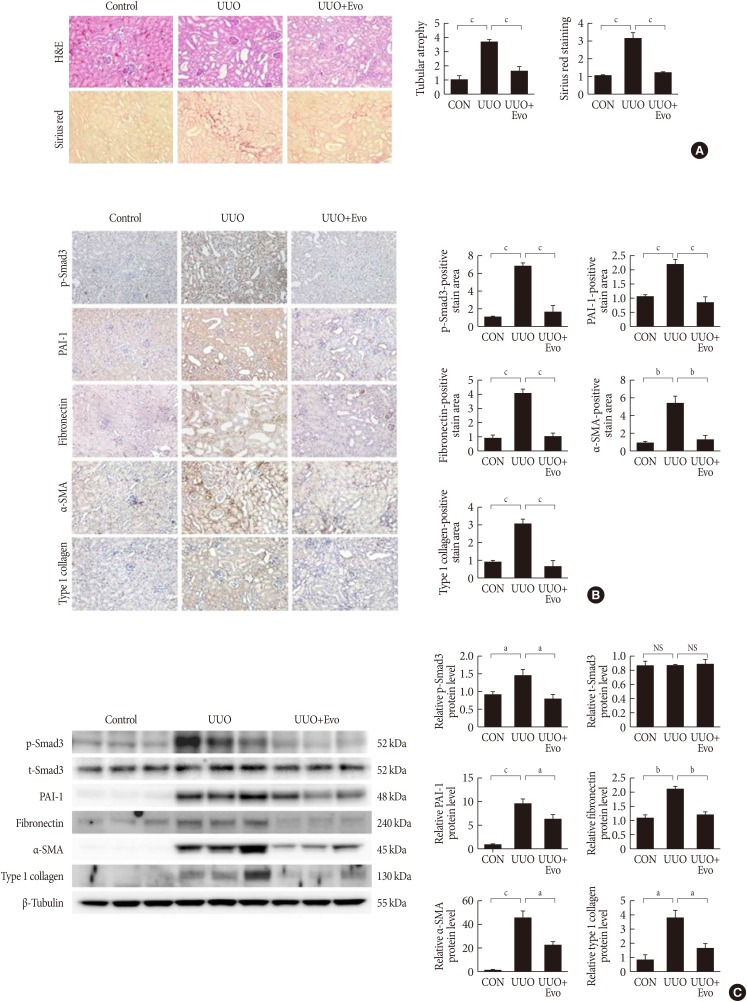
Fig. 1. Effects of evogliptin (Evo) on renal fibrosis and pro-fibrotic gene expression in kidneys of unilateral ureteral obstruction (UUO) mice. A UUO kidney from a mouse at day 11. (A) Representative images of hematoxylin and eosin (H&E) and Sirius red staining of kidney tissue sections from control (CON) mice and UUO mice treated with (300 mg/kg) or without Evo. The number of atrophic tubules was determined by measuring the amount of abnormal irregular and dilated tubular basement membranes in H&E-stained sections under high power magnification (×200). Areas of positive staining with Sirius red were quantitated by computer-based morphometric analysis. All morphometric data were normalized against the corresponding val-ues in CON animals. Data in all bar graphs are expressed as fold increases relative to the CON (n=6 in each group). (B) Representative images of immunohistochemical staining for phosphorylated-Smad3 (p-Smad3), plasminogen activator inhibitor 1 (PAI-1), fibronectin, α-smooth muscle actin (α-SMA), and type I collagen in kidney tissue sections from CON mice or UUO mice treated with (300 mg/kg) or without Evo (n=6 in each group). Areas of positive staining with p-Smad3, PAI-1, fibronectin, α-SMA, and type I collagen antibodies were quantitated by computer-based morphometric analysis. Data are the mean±standard error of the mean (SEM) of five random fields from each kidney. (C) Representative western blot analysis of p-Smad3, total-Smad3 (t-Smad3), PAI-1, fibronectin, α-SMA, and type I collagen protein level in UUO kidneys from mice treated with (300 mg/kg) or without Evo (n=6 in each group). Data in the bar graphs are the mean±SEM. NS, not significant. aP<0.05, bP<0.01, cP<0.001.

