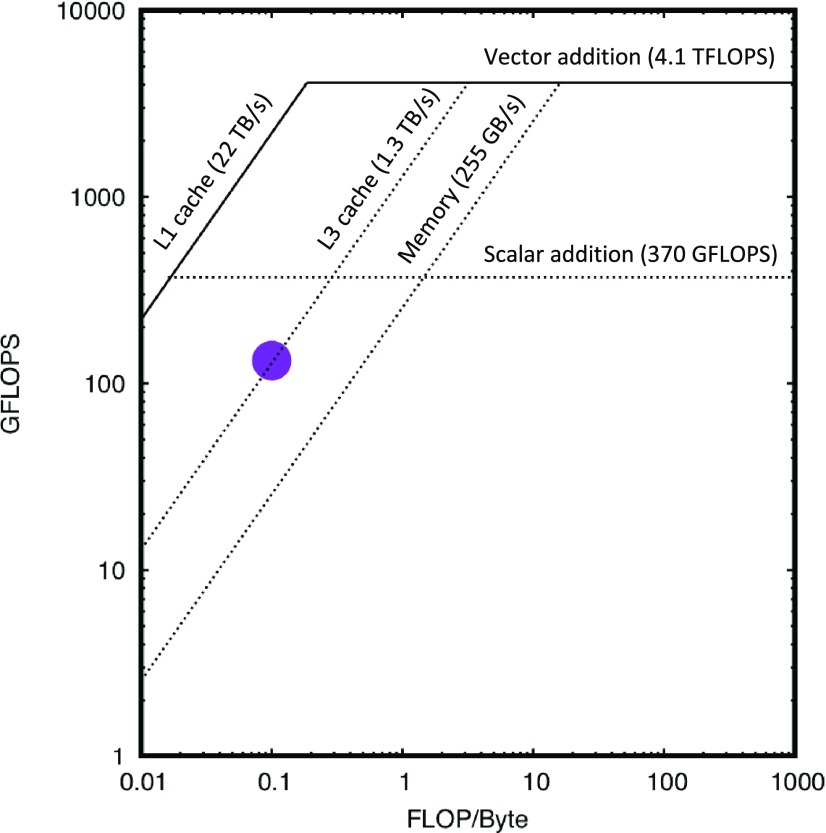
FIG. 3.
Roofline analysis is a method to compare the performance of a current implementation (loop, function) with the best possible for given hardware. Two values are taken into account—arithmetic intensity, i.e., the number of floating-point operations per volume of data (X-axis) and performance, i.e., the number of floating-point operations per unit of time (Y-axis). Dotted lines represent “ceilings”—horizontal lines correspond to limits on the number of CPU operations, while diagonal lines represent bandwidth limitation of memory and CPU cache. A purple dot represents the performance of Loop3 on Fig. 2 (no frame summation)—since the dot is positioned above the DDR memory ceiling, it shows that the procedure is using the full performance of CPU cache of level 3 (L3). Both loop performance and roofline limits are measured with Intel Advisor 2019 and are aggregated over 48 cores. The number of floating-point operations per second is calculated over loop execution time only.

