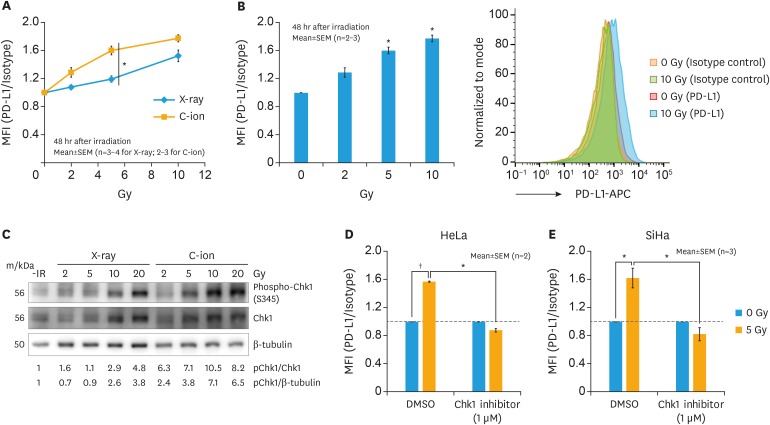
Fig. 1. PD-L1 expression in cells irradiated. (A) PD-L1 in HeLa. (B) PD-L1 in HeLa after C-ion irradiation. (C) Quantified blots for phosphorylated Chk1, Chk1, and β-tubulin (loading control) in HeLa. (D, E) C-ion-induced PD-L1 in HeLa (D) and SiHa (E) with Chk1 inhibition.
APC, antigen-presenting cell; C-ion, carbon-ion; DMSO, dimethyl sulfoxide; MFI, mean fluorescence intensity; PD-L1, programmed cell death-ligand 1; SEM, standard error of the mean.
*p<0.05; †p<0.01.

