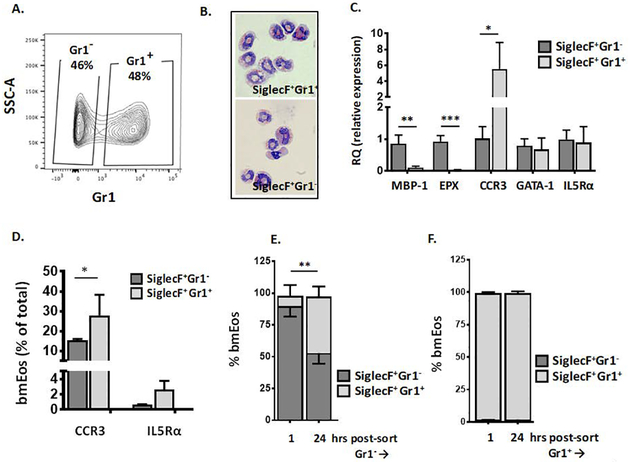
Fig. 2. Characterization of SiglecF+Gr1− and SiglecF+Gr1+ bone marrow-derived eosinophils (bmEos).
Unselected bone marrow cells were grown under standard conditions for four days with 100 μg/mL SCF and 100 μg/mL FLT3L. At day 4, these factors are replaced with IL-5 (10 ng/mL) as described in the Methods. A. Flow plot demonstrating the distribution of bmEos at day 11 of culture into SiglecF+Gr1− and SiglecF+Gr1+ fractions. B. Modified Giemsa-stained SiglecF+Gr1− and SiglecF+Gr1+ bmEos, original magnification, 64x. C. Relative expression (RQ) of transcripts encoding eosinophil major basic protein-1 (MBP-1), eosinophil peroxidase (EPX), CCR3, GATA-1, and interleukin-5 receptor alpha chain (IL5Rα) in SiglecF+Gr1− vs. SiglecF+Gr1+ eosinophils as in A.; n = 3 per group, *p < 0.05, **p < 0.01, ***p < 0.005; 1-way ANOVA. D. Percent of SiglecF+Gr1− vs. SiglecF+Gr1+ bmEos that express cell surface receptors for CCR3 and IL5Rα; n = 3 per group, *p < 0.05, Mann-Whitney u-test. E. SiglecF+Gr1− bmEos separated as shown in A., returned to culture and evaluated 1 hr and 24 hrs later; SiglecF+Gr1+ (light bar; above), SiglecF+Gr1− (dark bar; below; see also Suppl. Fig. 3 for total cell counts and viability), n = 3 per group, **p < 0.01 Mann-Whitney u-test. F. SiglecF+Gr1+ bmEos separated as in A., returned to culture and evaluated 1 hr and 24 hrs later; SiglecF+Gr1+ (light bar; see also Suppl. Fig. 3 for total cell counts and viability), n = 3 per group.

