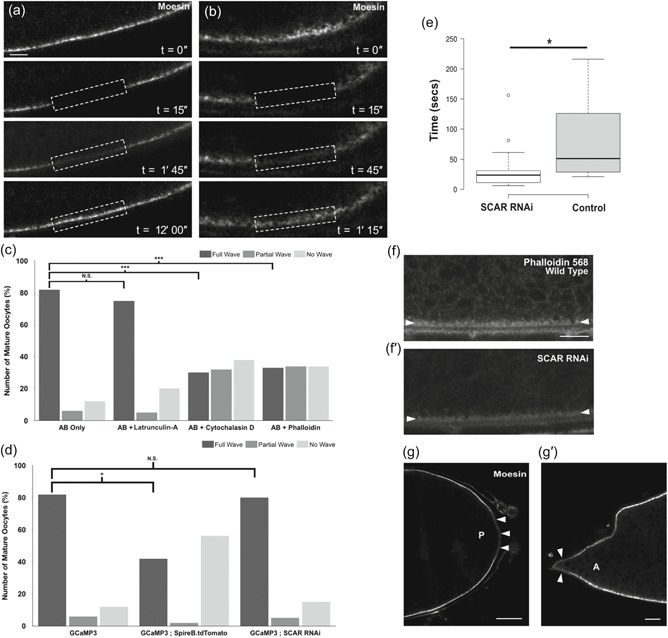
Figure 2.

A dynamic actin cytoskeleton is required for a calcium wave at egg activation. (a–b′,g,g′) Egg chamber expressing GFP‐moesin. Images were acquired using an Olympus FV3000 confocal microscope. (a,b) Fluorescence recovery after photobleaching (FRAP) of GFP‐moesin before and after ex vivo egg activation (n = 5). GFP‐moesin labeling actin at the lateral cortex is reduced to 25% of original fluorescent intensity following a bleaching step. In both Stage 14 mature egg chambers before activation (a) and after activation (b) recovery can be detected. In the unactivated oocyte, full recovery is complete at 12 min post‐bleaching. However, in the activated oocyte recovery is substantially faster post‐activation (14 vs. 45 s recovery halftime, n = 5). Note that movement caused by the addition of activation buffer (AB) meant that recovery could only be recorded for 1 min and 15 s postbleach. The dashed white box denotes the bleached region. (c) Graph showing calcium wave phenotypes when mature oocytes are treated with AB and the actin perturbing drugs latrunculin A, cytochalasin D, or phalloidin. A “full wave” indicates the calcium wave traversed the whole oocyte, a “partial wave” indicates that the calcium wave initiated but did not traverse the whole oocyte, and a “no wave” phenotype indicates that a calcium wave never initiated. When only AB is added, 82% of oocytes displayed full waves. The addition of latrunculin A shows a nonsignificant decrease in full waves to 72% (n = 20; p = .5). Mature oocytes treated with cytochalasin D or phalloidin show a significant decrease in full waves observed to 28% and 32%, respectively (n = 35 for each, Fisher's exact statistical analysis, p = .0001 [***]). (d) Graph showing calcium wave phenotypes when mature oocytes are treated with AB in GCaMP3 controls, overexpression of Spire B and knockdown of scar. When Spire B is overexpressed there is a significant decrease, to 40%, in the number of activated mature oocytes that show a full calcium wave, and an increase in the number of “no wave” phenotypes to 58% (n = 12, Fisher's exact statistical analysis, p < .05). When scar is knocked down using RNAi, there were no significant changes in the calcium wave phenotype. (e) Boxplot showing the speeds of calcium entry into the mature oocyte in control (GCaMP3) and scar RNAi mature oocytes (n = 15 and n = 18). Speed of calcium entry was determined as the time taken from the addition of AB to the time of first GCaMP fluorescence detection in the oocyte. Initial calcium entry was observed by eye and confirmed through quantification of the fluorescence signal, using a threshold of a 10% increase from the oocyte background. Images were taken every 3 s. There was a significant decrease in the time taken for calcium to enter the oocyte in the scar RNAi background (p < .05). (f,f′) Stage 14 egg chambers fixed and labeled for actin with phalloidin (n = 10). More actin is detected at the cortex in a wild‐type egg chamber (f) compared with a scar RNAi expressing egg chamber (f′). White arrowheads mark the lateral cortex of the egg chamber. (g,g′) In the Stage 14 egg chamber, before egg activation, GFP‐moesin is less enriched at the posterior pole (g) of the oocyte (white arrowheads) as compared with elsewhere of the oocyte cortex (paired t test p < .05, n = 20). Observation of GFP‐moesin at the anterior pole was challenging due to the presence of the dorsal appendages. However, in some (~40%; n = 25) oocytes Moesin is depleted compared with the lateral cortex (g′) and in these oocytes the depletion is significant (paired t test p < .05, n = 10). Single plane image (a,b,f,g). Scale bar = 10 µm (a,b), 20 µm (f,g)
