Figure 3.

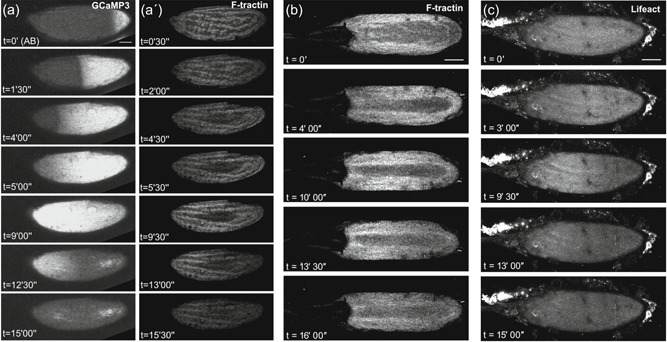
Actin wavefront dynamics follow calcium changes at egg activation. Time series of a mature egg chamber coexpressing GCaMP3 and F‐Tractin.tdTomato (a), or only expressing F‐Tractin.tdTomato (b) or Lifeact::mCherry (c). (a) At activation with activation buffer (AB) (n = 9), a calcium wave (a) initiates from the posterior pole (t = 0′) and propagates across the entire egg. A corresponding wavefront of F‐tractin (a′) initiates from the posterior pole and traverses the egg. Analysis of the fluorescence intensity shows that the calcium wave initiates on average 106 s after the addition of AB (SEM = 11.5 s), traverses the whole oocyte by 267 s (SEM = 42 s) and has recovered back to its initial level by 737 s (SEM = 148.37 s). A wave of filamentous actin (F‐actin) follows behind this calcium wave, initiating on average 220 s after the addition of AB (SEM = 60 s). The actin wave traverses the whole oocyte by 503 s (SEM = 72 s) and has recovered to its initial state by 829 s (SEM = 222 s). On average, the F‐actin wave lags behind the calcium wave by 103 s. As shown in Movie 6. Images were acquired using an inverted Leica SP5 confocal microscope sequentially, with a scan time of approximately 30 s per Z‐stack. (b) F‐actin, labeled by F‐tractin (n = 15), shows a posterior to anterior wavefront following the addition of AB (t = 0′). The wave initiates (t = 4′), propagates across the oocyte to the anterior pole (t = 10′) and recovers (t = 16′). As shown in Movie 7. Images were acquired using an inverted Leica SP5 confocal microscope. (c) F‐actin, labeled by Lifeact (n = 10), shows a similar actin wavefront as F‐tractin (b) in its initiation (t = 3′), propagation (t = 9′30″) and recovery (t = 15′). The bright fluorescence outside of the egg chamber is ovarian tissue associated with the dissection, as shown in movie 6, 7, and 9. Images were acquired using an inverted Leica SP5 confocal microscope. Image a projection of 40 µm (a,b,c). Scale bar = 60 µm (a–c). AB, activation buffer; SEM, standard error of the mean
