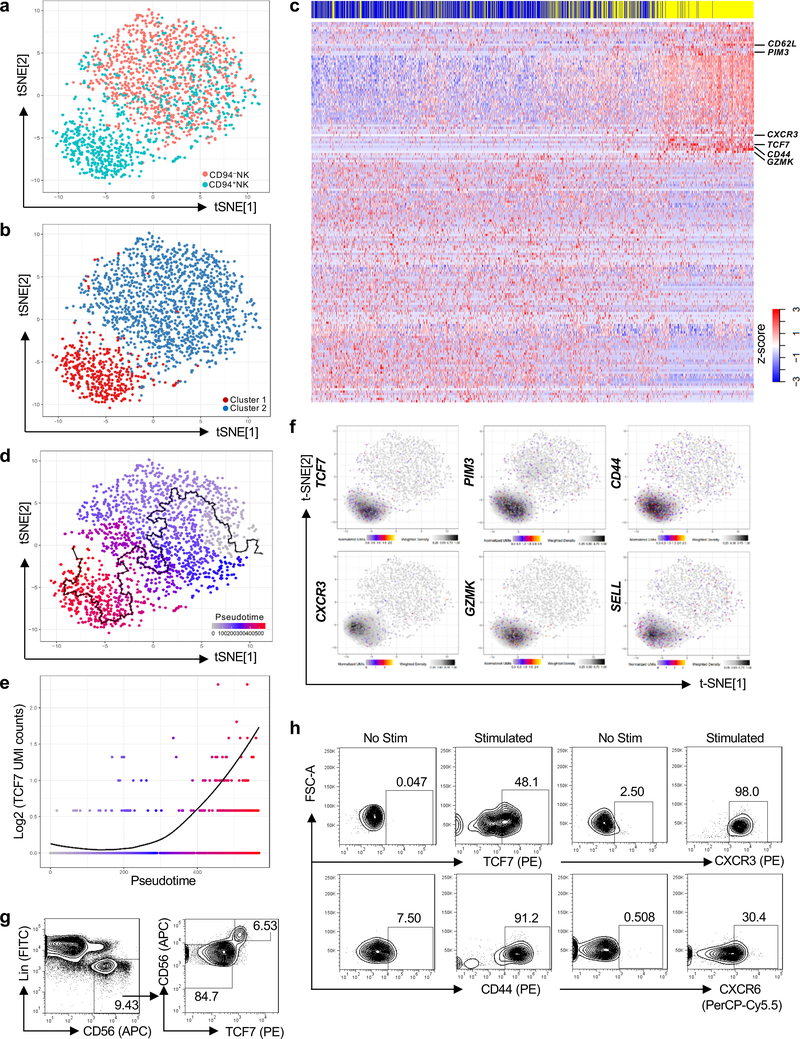
Fig. 3 |. TCF7 expression correlates with pseudotime trajectory from CD94−NK cells to CD94+NK Cells.
a, Two-dimensional tSNE plot of single cell RNA-Seq of 986 Lin−CD56+CD94−NK cells (pink) and 767 Lin−CD56+CD94+NK cells (aqua), sorted from HIV-1− blood. Data are representative of 2 donors. b, Spectral clustering of single cell transcriptomes from all cells in a, independent of CD94, k-nearest neighbor, search=2. c, Heatmap of 1,729 CD94−NK cells (blue) and 1,548 CD94+NK cells (yellow), sorted from 2 HIV-1− anonymous blood donors, using all differentially expressed genes from the spectral cluster analysis. d, Minimum spanning tree based on the transcriptome of individual cells from a, showing pseudotime trajectory (black line). e, TCF7 expression along the pseudotime trajectory. f, Expression and density of the indicated genes within t-SNE plots. g, Flow cytometry for CD56 and TCF7 on Lin− PBMCs. h, Sorted CD94−NK cells were untreated (No Stim) or treated with IL-15 (5 ng/ml) for 5 days, and IL-12 (50 ng/ml) and IL-15 (50 ng/ml) for 16 hrs (Stimulated). TCF7, CD44, CXCR3, and CXCR6 were detected by flow cytometry. TCF7, representative of 8 donors; CD44, CXCR3, and CXCR6, representative of 4 HIV-1− donors. All data were generated using blood from HIV-1− donors.

