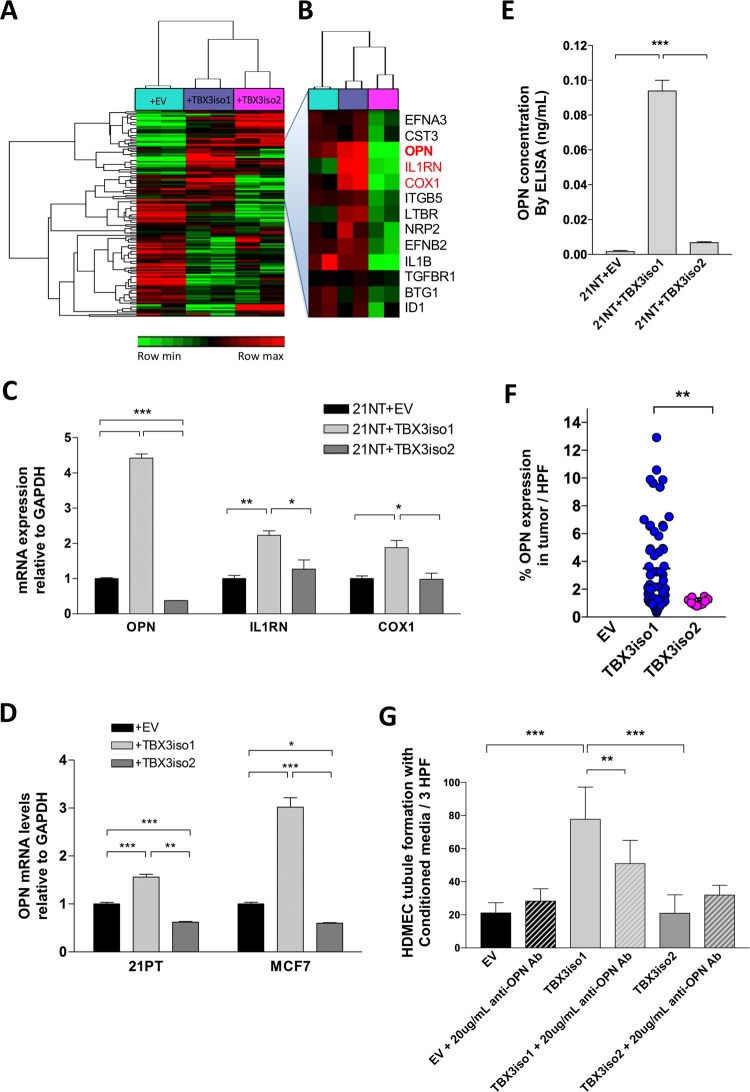
Fig. 3.
OPN is specifically up-regulated by TBX3iso1. a Heat map showing expression of 222 angiogenesis-related transcripts by RNA-Seq across 21NT + EV, 21NT + TBX3iso1, and 21NT + TBX3iso2 cell lines. b Cluster showing up-regulation of pro-angiogenic transcripts with TBX3iso1 overexpression and down-regulation with TBX3iso2 overexpression. Osteopontin (OPN), IL1RN, and COX1 are shown in red. c Expression of OPN, IL1RN, and COX2 mRNA levels in 21NT transfectant cell lines was assessed by qRT-PCR, normalized to GAPDH expression levels, and depicted as fold changes relative to the empty vector control. d Expression of OPN mRNA levels in 21PT and MCF7 transfectants was assessed by qRT-PCR, normalized to GAPDH levels, and depicted as fold changes relative to the empty vector control. e OPN protein levels in conditioned media was assessed by ELISA and normalized to cell numbers. Human recombinant OPN (hrOPN) was used to generate a standard curve for determination of absolute OPN protein concentration. f Primary tumors were stained for OPN by immunohistochemistry. Slides were scanned, digital images were thresholded and the percentage of positive signal within the image area was quantified. The percentage of the high power field (HPF) positive for OPN is shown across ten fields of view per tumor. g Tubule formation assay with OPN neutralizing antibody to assess in vitro angiogenesis. Conditioned media was collected after a 48 h incubation with 1.0 × 10⁶ cells of each cell type. Conditioned media was tested (either in the presence or absence of 20µg/mL anti-OPN antibody) by incubating with human dermal microvascular endothelial cells (HDMEC) on growth factor reduced Matrigel (96-well format) for 16 h at 37 °C to allow for vascular channel formation. The number of tubule branch points per three high-power fields (one well) was quantified at 16 h mark. *p < 0.05, **p < 0.01, ***p < 0.001 by one-way ANOVA with Tukey post-hoc for comparison between three groups, and student’s t test for comparison between two groups. Error bars represent standard deviation

