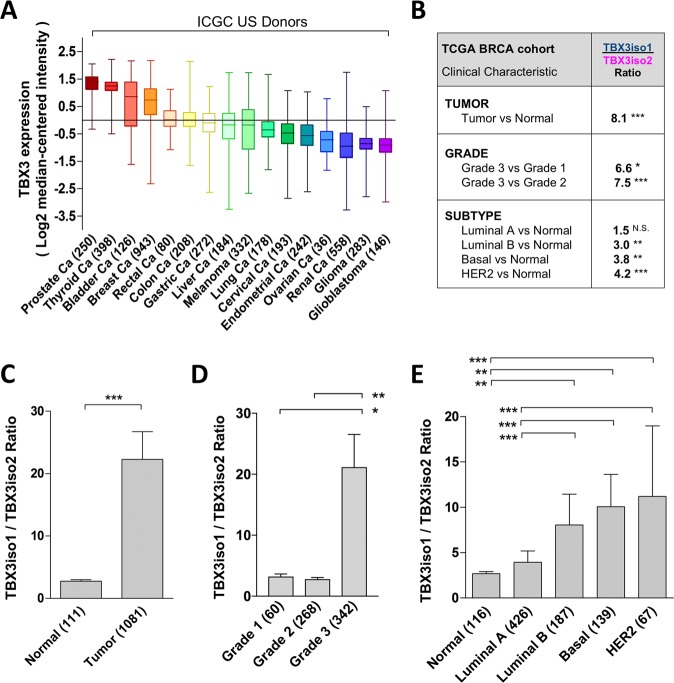
Fig. 5.
Cancer progression involves an increase in TBX3iso1 to TBX3iso2 ratio. a Assessment of the International Cancer Genome Consortium (ICGC) data shows total TBX3 mRNA levels across tumor subtypes (shown in various colors). Total TBX3 mRNA expression in breast cancer is shown in orange. b TBX3 isoform ratios were interrogated in the Cancer Genome Atlas (TCGA) breast cancer (BRCA) cohort by calculating the total transcript reads for TBX3iso1 over the total transcript reads for TBX3iso2 for each patient. Ratios were compared between normal and tumor tissues (c), and compared across tumor characteristics including grade (d) and molecular subtype (e). *p < 0.05, **p < 0.01, ***p < 0.001 by the nonparametric Kruskal–Wallis statistic with Dunn’s post-hoc test due to non-Gaussian distribution of ratios. Error bars represent standard deviation

