Fig. 6.
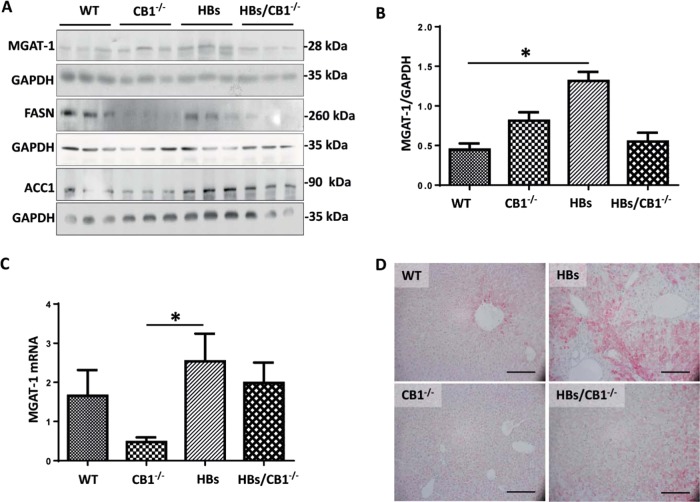
CB1 knockout induced suppression of lipogenesis in HBs transgenic mice. a Western blot analysis of liver lysates of 52-week-old mice was performed using specific anti-MGAT1, anti-FASN, and anti-ACC1 antibodies. Equal protein loading was controlled by anti-GAPDH and anti-β-actin antibodies, respectively. b Bar graph representing normalized MGAT1 protein expression to GAPDH. Statistic, one-way ANOVA, Kruskal–Wallis test (P = 0.004), Dunnet’s multiple comparison test were performed. c Quantitative real-time PCR (qRT-PCR) analysis of MGAT1 transcript was performed. The amount of RNA in the different samples is normalized to β-actin as reference gene and shown as relative expression (ΔΔCt). Statistical analysis was performed in GraphPad, One-way ANOVA (Kruskal–Wallis test, P = 0.0053). Dunn’s multiple comparison test was used to compare among different group. d Representative immunohistochemistry of paraffin section using specific DGAT1 antibody. Magnification, ×200 bar 200 µm

