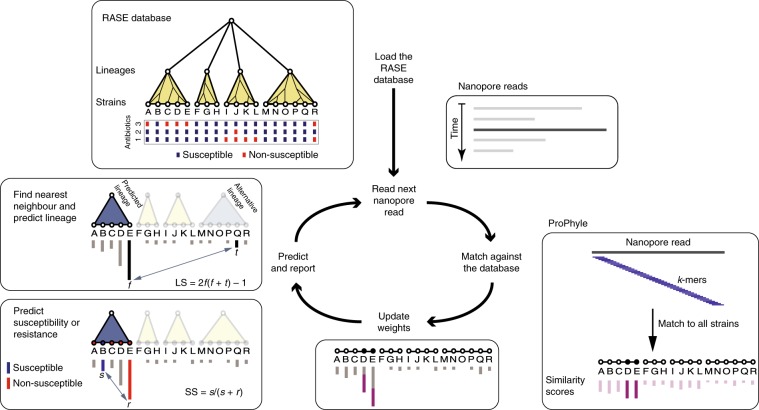
Fig. 1. Overview of the RASE approach.
In the first loading step, the precomputed RASE database is loaded into memory. As reads are generated, they are matched against the database using ProPhyle to calculate similarity to individual strains. The weights for the most similar strains (D and E in the figure) are increased proportionately to the number of matching k-mers. Finally, resistance is predicted from the obtained weights and from the resistance profiles of the database strains in the following manner. First, the best lineage is identified as the lineage of the best match (having the highest weight, E in the figure) and its score is calculated (lineage score (LS)). Second, for every antibiotic, a score quantifying the chance of susceptibility (susceptibility score (SS)) is calculated based on the most similar susceptible and resistant strains inside the identified lineage (B and E in the figure, respectively). The susceptibility or resistance to each of the antibiotics is predicted from their susceptibility scores by a comparison with a threshold (0.5 in the default setting) and reported together with the lineage, the best matching strain and the known properties of that strain (for example, the original antibiograms and the MLST-identified sequence type or serotype).

