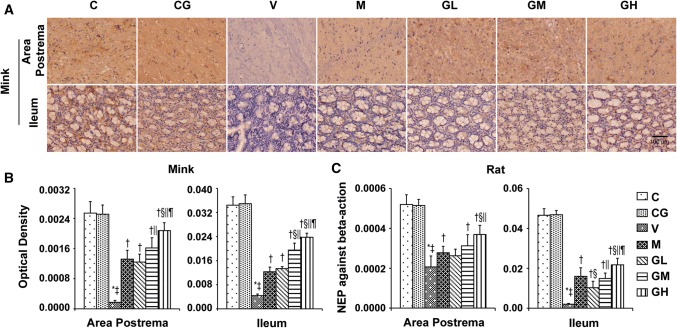
Fig. 10.
NEP expression in area postrema in addition to ileum of rats and minks. a Immunohistochemistry manifestation of NEP in area postrema plus ileum of minks (n = 6). Bar indicates 100 µm. b Mean optical density values of NEP of minks. The images were quantified by Image-Pro Plus. c The mRNA manifestation of NEP was examined by qRT-PCR in area postrema and ileum of rats (n = 5). C normal control group, CG simple gingerol control group, V cisplatin control group, M cisplatin + metoclopramide group, GL cisplatin + low-dose gingerol group, GM cisplatin + middle-dose gingerol group, GH cisplatin + high-dose gingerol group. *P < 0.05 vs. Group C, ‡P < 0.05 vs. Group CG, †P < 0.05 vs. Group V, §P < 0.05 vs. Group M, ||P < 0.05 vs. Group GL, ¶P < 0.05 vs. Group GM. NEP neutral endopeptidase

