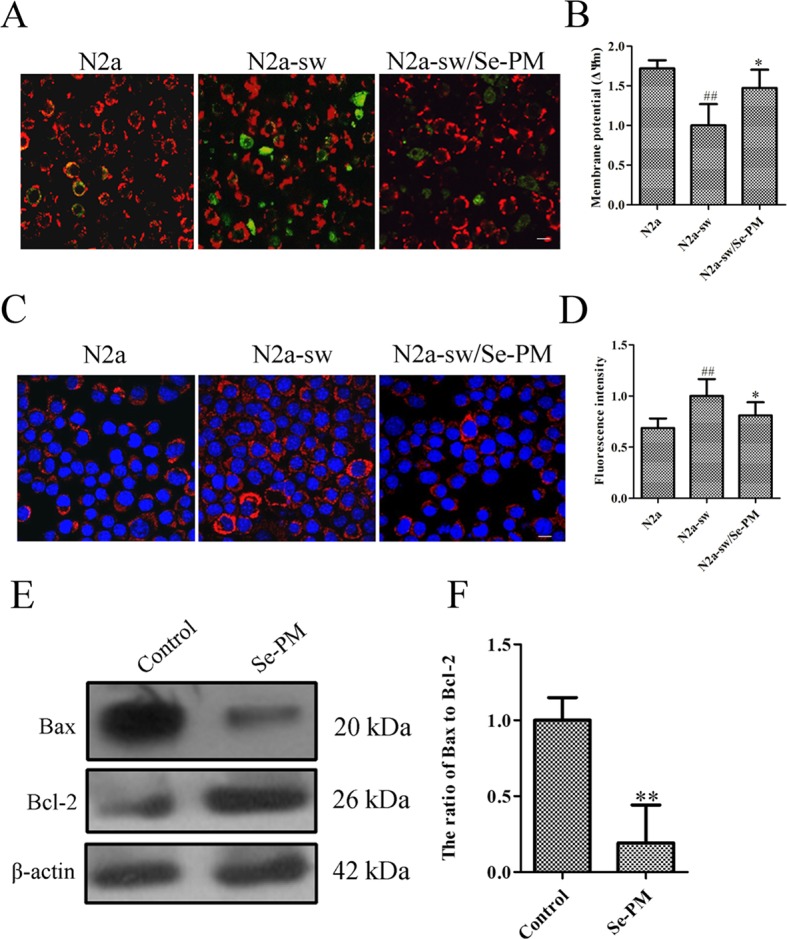
Figure 4.

Effects of Se-PM (0.5 mg/mL) on cell apoptosis in N2a-sw cells. (A, B) Immunofluorescence analysis of the mitochondrial membrane potential (A) and statistical analysis (B). (C, D) Immunofluorescence analysis of cytochrome c release (C) and statistical analysis (D). (E, F) Protein expression levels of Bax/Bcl-2, detected by Western blot analysis (E) and statistical analysis (F). Indicates significant differences between the N2a-sw cells and N2a cells, ##p < 0.01. *Indicates significant differences between the Se-PM-treated groups and control in N2a-sw cells, * p < 0.05. ** p < 0.01. Scale bar = 20 μm.
